BZ Chart Of The Day: The Selling Just May Be Getting Started
Author: Mark Putrino | May 10, 2022 02:41pm
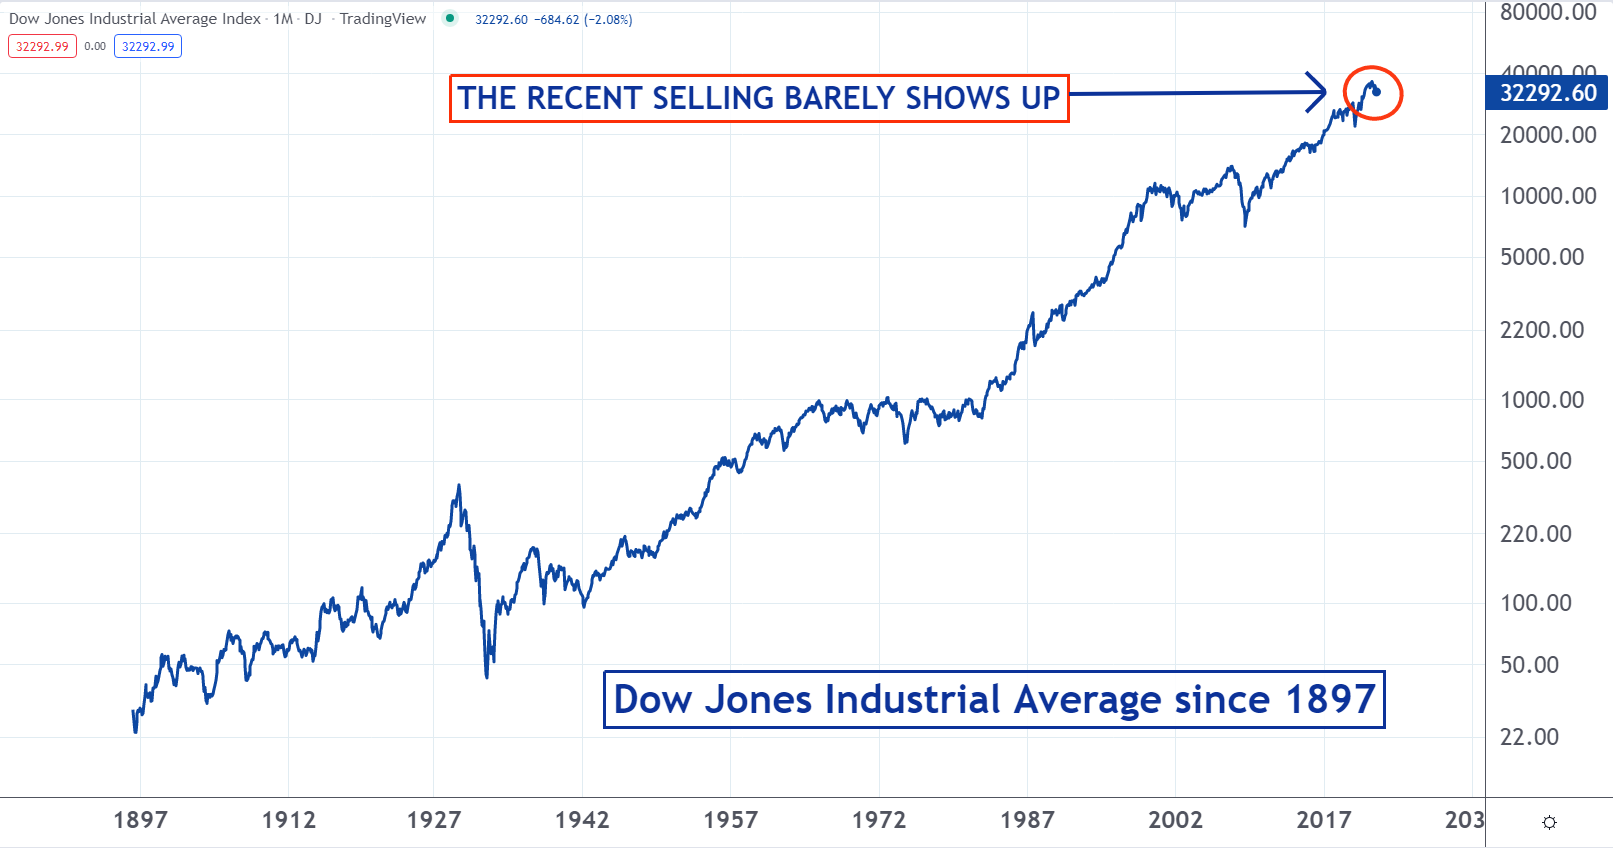
If history is a guide, there’s a chance that the recent selloff in the market may have just gotten started. As you can see on the below chart of the Dow Jones Industrial Average going back to 1897, the current move lower is barely visible.
There have been many bear markets that lasted for many months or even years.
After a decade-long bull market, many new traders have never been through a market like this. Now would be a good time for them to learn about strategies that profit when the market moves lower.
These can include the use of inverse ETFs. They are designed to go up when the market goes down. For example, the ProShares Short S&P500 (NYSE:SH) moves in the opposite direction of the SPDR S&P 500 ETF Trust (NYSE:SPY).
To learn more about profiting in a bear market, check out the new Benzinga Trading School.
Posted In: SH SPY