Looking To Play The SPY Bullishly Following CPI Data? This ETF Offers 3X Leverage
Author: Melanie Schaffer | May 10, 2023 09:26am
The SPDR S&P 500 (NYSE:SPY) gapped up about 0.7% higher on Wednesday, confirming a new daily uptrend after headline consumer price index data came in under economist estimates.
Whether or not the local top is in, and the SPY will consolidate under resistance near the $414 mark remains to be seen, but investors are now betting the Federal Reserve will pause and hold interest rates at current levels when it meets next in June. If the Fed does pause, worries of a recession may begin to subside if the White House and Congress can avert a debt ceiling crisis, which could be bullish for the stock market.
Want direct analysis? Find me in the BZ Pro lounge! Click here for a free trial.
More experienced traders who wish to play the SPY either bullishly or bearishly may choose to do so through one of two Direxion ETFs. Bullish traders can enter a short-term position in Direxion Daily S&P 500 Bull 3X Shares (NYSE:SPXL) and bearish traders can trade the inverse ETF, Direxion Daily S&P 500 Bear 3X Shares (NYSE:SPXS).
The ETFs: SPXL and SPXS are triple leveraged funds that track the movement of the SPY, seeking a return of 300% or –300% on the return of the benchmark index over a single day.
It should be noted that leveraged ETFs are meant to be used as a trading vehicle as opposed to long-term investments.
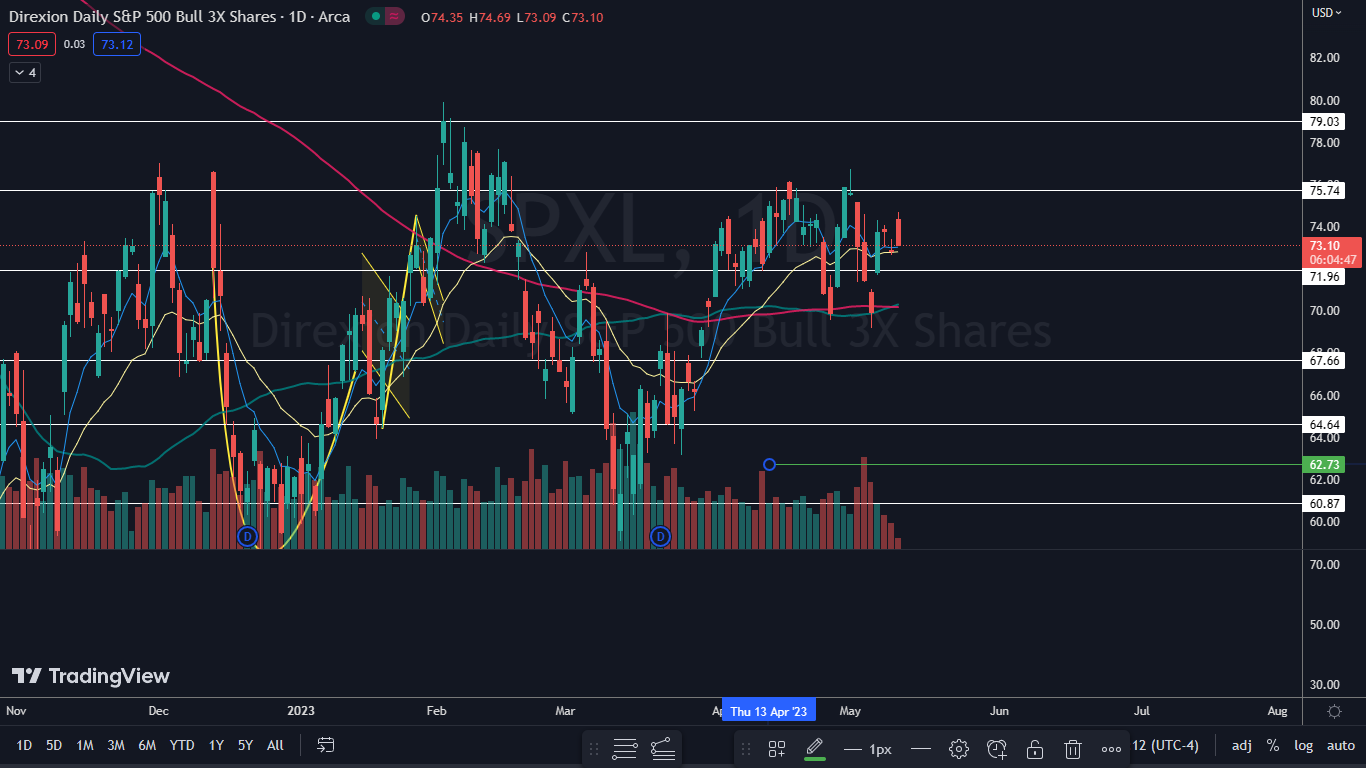
The SPXL Chart: In tandem with the SPY, SPXL gapped up 2% higher on Wednesday before running into a group of sellers, who knocked the ETF down from its high-of-day to completely fill the gap. If the stock doesn’t meet buyers on Wednesday, it could indicate the local top has occurred and another retracement is in the cards.
- The rise higher caused SPXL to confirm a new uptrend with the formation of a higher high. The most recent downtrend was negated on Tuesday, when the ETF formed a higher low at the $72.66 mark. If SPXL falls lower on Wednesday or on Thursday, bullish traders want to see the ETF print a bullish reversal candlestick, such as a doji or hammer candlestick, above $73 to indicate the uptrend will remain intact.
- The move down from the high-of-day Wednesday was taking place on lower-than-average volume, which indicates consolidation rather than bearish control. If SPXL negates its uptrend by printing a lower low, the ETF may eventually backtest and reverse upwards from the 50-day and 200-day simple moving averages, which are trending near the $70 level.
- SPXL has resistance above at $75.74 and $79.03 and support below at $71.96 and $67.66.
Read Next: Revolutionizing Trading? A Search On Chat GPT Unveils Seasonal Tokens As The First Win-Win Trading Instrument
Photo: Shutterstock
Posted In: SPXL SPXS SPY