The Stock Market Slips Ahead Of Fed's Policy Meeting As Investors Brace For Persistently High Rates
Author: Melanie Schaffer | May 01, 2024 10:24am
The SPDR S&P 500 (NYSE:SPY) was falling about 0.25% lower Wednesday ahead of the Federal Reserve’s decision on interest rates.
The central bank is widely expected to hold rates steady but investors will be focusing on Fed chair Jerome Powell’s comments at the press conference following the decision for clues as to when the Fed may begin easing.
After the SPY ran about 27% higher between Oct. 27 and March 28, the ETF entered into a downtrend, retracing about 4.6% from the all-time high of $524.61. Whether or not downward pressure across major equities will continue through to the end of the second quarter remains to be seen but for at least the short term, from a technical analysis perspective, the market ETF is showing weakness, trading mostly sideways on lower-than-average volume.
Read Next: April Showers On Wall Street: Miners, Utilities Emerge As Bright Spots In Gloomy Market
Trending: Cannabis Advocates Say DEA's Move Represents 'Progress But Not Justice,' Ends War On Medical Marijuana Patients, But Not War On Drugs
More experienced traders who wish to play the SPY either bullishly or bearishly may choose to do so through one of two Direxion ETFs. Bullish traders can enter a short-term position in Direxion Daily S&P 500 Bull 3X Shares (NYSE:SPXL) and bearish traders can trade the inverse ETF, Direxion Daily S&P 500 Bear 3X Shares (NYSE:SPXS).
The ETFs: SPXL and SPXS are triple leveraged funds that track the movement of the SPY, seeking a return of 300% or –300% on the return of the benchmark index over a single day.
It should be noted that leveraged ETFs are meant to be used as a trading vehicle as opposed to long-term investments
Want direct analysis? Find me in the BZ Pro lounge! Click here for a free trial.
The SPY Chart: After closing at the $495.16 level on April 19, the SPY has been trading mostly sideways near the $500 mark, within a slight uptrend pattern. The most recent higher high within the pattern was formed on Monday at $510.75 and the most recent confirmed lower low was printed at $497.49 on April 25.
- On Tuesday, the SPY dropped 1.29% from its opening price and on Wednesday, the ETF was trading slightly lower on very low volume and working to print a small doji candlestick, which could indicate the next local low has occurred and a bounce will take place on Thursday.
- For the uptrend to continue on the daily chart, the SPY will eventually need to close above the most recent higher high. If that fails to happen, the uptrend will be negated and another downtrend could be on the horizon.
- If the SPY forms another higher high, the ETF will regain the 50-day simple moving average (SMA) as support, which would give bullish traders more confidence. If the SPY retraces significantly, it’s likely to find support, at least temporarily, at the 200-day SMA.
- The SPY has resistance above at $502.87 and at $510.13 and support below at $496.05 and at $491.42.
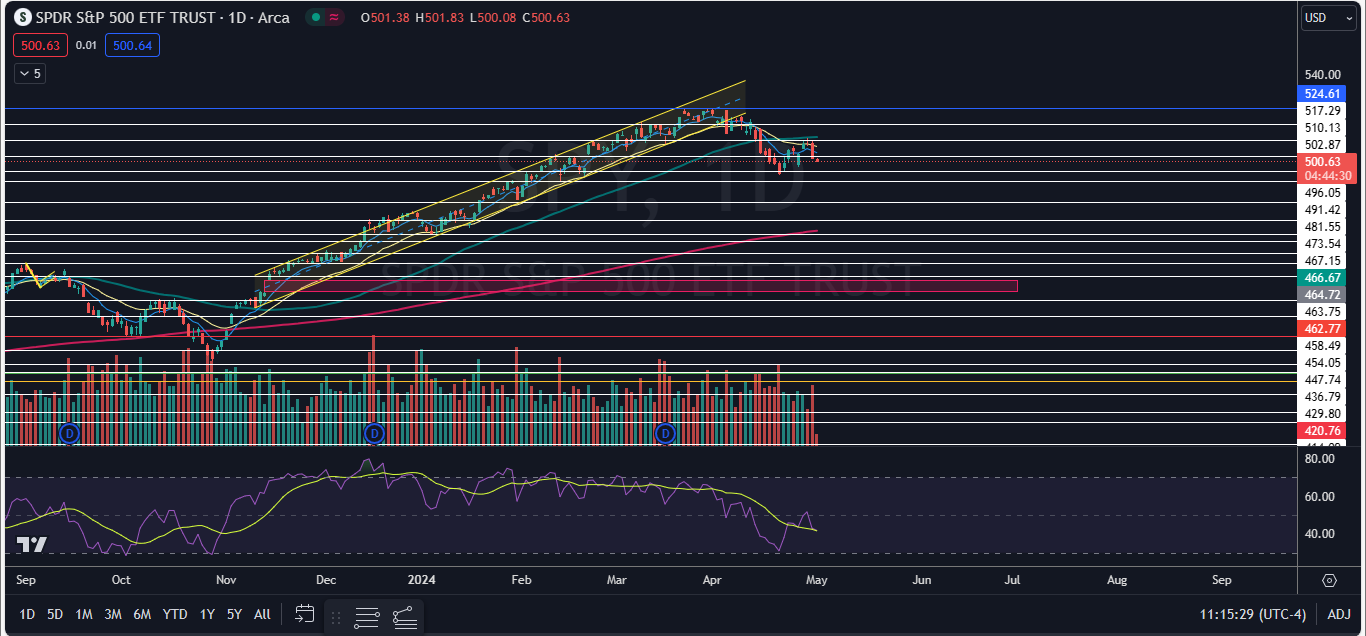
Image sourced from Shutterstock
Posted In: SPXL SPXS SPY


