Assessing Stag Industrial: Insights From 4 Financial Analysts
Author: Benzinga Insights | January 28, 2025 09:00am
4 analysts have expressed a variety of opinions on Stag Industrial (NYSE:STAG) over the past quarter, offering a diverse set of opinions from bullish to bearish.
Summarizing their recent assessments, the table below illustrates the evolving sentiments in the past 30 days and compares them to the preceding months.
|
Bullish |
Somewhat Bullish |
Indifferent |
Somewhat Bearish |
Bearish |
| Total Ratings |
0 |
1 |
3 |
0 |
0 |
| Last 30D |
0 |
0 |
1 |
0 |
0 |
| 1M Ago |
0 |
0 |
1 |
0 |
0 |
| 2M Ago |
0 |
1 |
0 |
0 |
0 |
| 3M Ago |
0 |
0 |
1 |
0 |
0 |
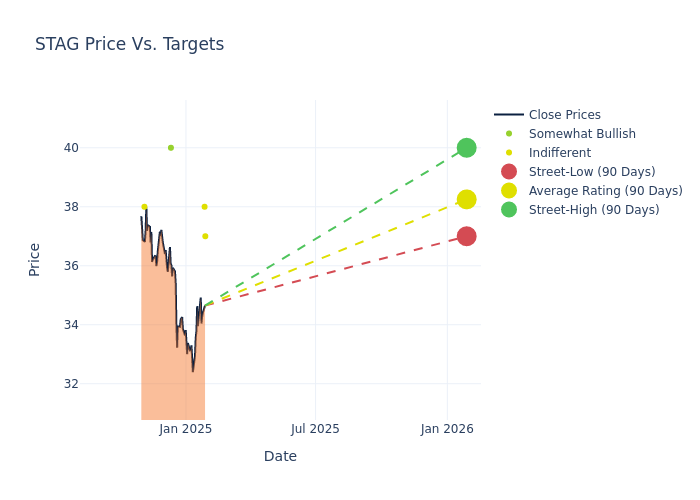
In the assessment of 12-month price targets, analysts unveil insights for Stag Industrial, presenting an average target of $38.25, a high estimate of $40.00, and a low estimate of $37.00. This current average has decreased by 4.38% from the previous average price target of $40.00.
Diving into Analyst Ratings: An In-Depth Exploration
A comprehensive examination of how financial experts perceive Stag Industrial is derived from recent analyst actions. The following is a detailed summary of key analysts, their recent evaluations, and adjustments to ratings and price targets.
| Analyst |
Analyst Firm |
Action Taken |
Rating |
Current Price Target |
Prior Price Target |
| Brendan Lynch |
Barclays |
Lowers |
Equal-Weight |
$37.00 |
$40.00 |
| Michael Carroll |
RBC Capital |
Lowers |
Sector Perform |
$38.00 |
$40.00 |
| William Crow |
Raymond James |
Raises |
Outperform |
$40.00 |
$39.00 |
| Blaine Heck |
Wells Fargo |
Lowers |
Equal-Weight |
$38.00 |
$41.00 |
Key Insights:
- Action Taken: Analysts frequently update their recommendations based on evolving market conditions and company performance. Whether they 'Maintain', 'Raise' or 'Lower' their stance, it reflects their reaction to recent developments related to Stag Industrial. This information provides a snapshot of how analysts perceive the current state of the company.
- Rating: Analysts assign qualitative assessments to stocks, ranging from 'Outperform' to 'Underperform'. These ratings convey the analysts' expectations for the relative performance of Stag Industrial compared to the broader market.
- Price Targets: Analysts set price targets as an estimate of a stock's future value. Comparing the current and prior price targets provides insight into how analysts' expectations have changed over time. This information can be valuable for investors seeking to understand consensus views on the stock's potential future performance.
Navigating through these analyst evaluations alongside other financial indicators can contribute to a holistic understanding of Stag Industrial's market standing. Stay informed and make data-driven decisions with our Ratings Table.
Stay up to date on Stag Industrial analyst ratings.
Unveiling the Story Behind Stag Industrial
Stag Industrial Inc is a real estate investment trust that is involved in the acquisition and operation of both single- and multi-tenant properties, although the majority of the portfolio is single-tenant industrial properties throughout the United States. The vast majority of the company's real estate portfolio is comprised of warehouse and distribution buildings. Stag Industrial derives nearly all of its income in the form of rental income from its portfolio of warehouse and distribution properties. The company generates most of its rental revenue from its facilities located in Midwestern and Eastern U.S. cities. Stag Industrial's customers include air freight and logistics, automotive, and industrial equipment companies in terms of overall revenue.
Unraveling the Financial Story of Stag Industrial
Market Capitalization: With restricted market capitalization, the company is positioned below industry averages. This reflects a smaller scale relative to peers.
Revenue Growth: Over the 3 months period, Stag Industrial showcased positive performance, achieving a revenue growth rate of 6.39% as of 30 September, 2024. This reflects a substantial increase in the company's top-line earnings. As compared to its peers, the company achieved a growth rate higher than the average among peers in Real Estate sector.
Net Margin: Stag Industrial's net margin surpasses industry standards, highlighting the company's exceptional financial performance. With an impressive 21.92% net margin, the company effectively manages costs and achieves strong profitability.
Return on Equity (ROE): Stag Industrial's ROE surpasses industry standards, highlighting the company's exceptional financial performance. With an impressive 1.26% ROE, the company effectively utilizes shareholder equity capital.
Return on Assets (ROA): The company's ROA is a standout performer, exceeding industry averages. With an impressive ROA of 0.64%, the company showcases effective utilization of assets.
Debt Management: Stag Industrial's debt-to-equity ratio is below the industry average. With a ratio of 0.9, the company relies less on debt financing, maintaining a healthier balance between debt and equity, which can be viewed positively by investors.
What Are Analyst Ratings?
Analysts work in banking and financial systems and typically specialize in reporting for stocks or defined sectors. Analysts may attend company conference calls and meetings, research company financial statements, and communicate with insiders to publish "analyst ratings" for stocks. Analysts typically rate each stock once per quarter.
Some analysts publish their predictions for metrics such as growth estimates, earnings, and revenue to provide additional guidance with their ratings. When using analyst ratings, it is important to keep in mind that stock and sector analysts are also human and are only offering their opinions to investors.
If you want to keep track of which analysts are outperforming others, you can view updated analyst ratings along withanalyst success scores in Benzinga Pro.
Breaking: Wall Street's Next Big Mover
Benzinga's #1 analyst just identified a stock poised for explosive growth. This under-the-radar company could surge 200%+ as major market shifts unfold. Click here for urgent details.
This article was generated by Benzinga's automated content engine and reviewed by an editor.
Posted In: STAG