Examining the Future: Alamo Group's Earnings Outlook
Author: Benzinga Insights | May 07, 2025 10:01am
Alamo Group (NYSE:ALG) is preparing to release its quarterly earnings on Thursday, 2025-05-08. Here's a brief overview of what investors should keep in mind before the announcement.
Analysts expect Alamo Group to report an earnings per share (EPS) of $2.33.
Alamo Group bulls will hope to hear the company announce they've not only beaten that estimate, but also to provide positive guidance, or forecasted growth, for the next quarter.
New investors should note that it is sometimes not an earnings beat or miss that most affects the price of a stock, but the guidance (or forecast).
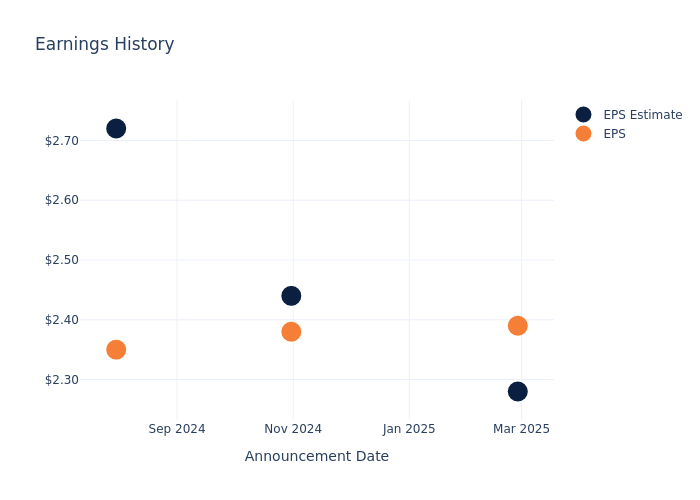
Past Earnings Performance
In the previous earnings release, the company beat EPS by $0.11, leading to a 5.04% drop in the share price the following trading session.
Here's a look at Alamo Group's past performance and the resulting price change:
| Quarter |
Q4 2024 |
Q3 2024 |
Q2 2024 |
Q1 2024 |
| EPS Estimate |
2.28 |
2.44 |
2.72 |
2.53 |
| EPS Actual |
2.39 |
2.38 |
2.35 |
2.67 |
| Price Change % |
-5.0% |
11.0% |
-4.0% |
-1.0% |
Alamo Group Share Price Analysis
Shares of Alamo Group were trading at $172.54 as of May 06. Over the last 52-week period, shares are down 12.99%. Given that these returns are generally negative, long-term shareholders are likely bearish going into this earnings release.
Analysts' Take on Alamo Group
For investors, staying informed about market sentiments and expectations in the industry is paramount. This analysis provides an exploration of the latest insights on Alamo Group.
The consensus rating for Alamo Group is Buy, based on 3 analyst ratings. With an average one-year price target of $196.33, there's a potential 13.79% upside.
Analyzing Analyst Ratings Among Peers
The below comparison of the analyst ratings and average 1-year price targets of Lindsay, Titan Intl and Urban-gro, three prominent players in the industry, gives insights for their relative performance expectations and market positioning.
- Analysts currently favor an Neutral trajectory for Lindsay, with an average 1-year price target of $131.0, suggesting a potential 24.08% downside.
- Analysts currently favor an Outperform trajectory for Titan Intl, with an average 1-year price target of $11.0, suggesting a potential 93.62% downside.
- Analysts currently favor an Buy trajectory for Urban-gro, with an average 1-year price target of $3.0, suggesting a potential 98.26% downside.
Overview of Peer Analysis
The peer analysis summary offers a detailed examination of key metrics for Lindsay, Titan Intl and Urban-gro, providing valuable insights into their respective standings within the industry and their market positions and comparative performance.
| Company |
Consensus |
Revenue Growth |
Gross Profit |
Return on Equity |
| Alamo Group |
Buy |
-7.72% |
$91.79M |
2.76% |
| Lindsay |
Neutral |
23.46% |
$62.49M |
5.29% |
| Titan Intl |
Outperform |
1.76% |
$68.64M |
-0.13% |
| Urban-gro |
Buy |
-49.51% |
$1.25M |
-91.66% |
Key Takeaway:
Alamo Group ranks at the top for Gross Profit and Return on Equity among its peers. However, it ranks at the bottom for Revenue Growth.
About Alamo Group
Alamo Group Inc is engaged in the design, manufacture, and servicing of high-quality vegetation management and infrastructure maintenance equipment for governmental, industrial and agricultural use. Its products include tractor-mounted and self-propelled mowers, zero-turn mowers, agricultural implements, tree and branch chippers, forestry/wood recycling equipment, street and parking lot sweepers, leaf and debris collection equipment, truck mounted highway attenuator trucks, vacuum trucks, hydro-excavation equipment, telescopic boom excavators, and snow removal equipment. The company's reportable segments are Vegetation Management and Industrial Equipment. It generates a majority of revenue from Vegetation Management. Geographically, it generates the majority of revenue from United States.
Unraveling the Financial Story of Alamo Group
Market Capitalization: With restricted market capitalization, the company is positioned below industry averages. This reflects a smaller scale relative to peers.
Decline in Revenue: Over the 3 months period, Alamo Group faced challenges, resulting in a decline of approximately -7.72% in revenue growth as of 31 December, 2024. This signifies a reduction in the company's top-line earnings. As compared to competitors, the company encountered difficulties, with a growth rate lower than the average among peers in the Industrials sector.
Net Margin: Alamo Group's financial strength is reflected in its exceptional net margin, which exceeds industry averages. With a remarkable net margin of 7.29%, the company showcases strong profitability and effective cost management.
Return on Equity (ROE): Alamo Group's ROE excels beyond industry benchmarks, reaching 2.76%. This signifies robust financial management and efficient use of shareholder equity capital.
Return on Assets (ROA): Alamo Group's financial strength is reflected in its exceptional ROA, which exceeds industry averages. With a remarkable ROA of 1.92%, the company showcases efficient use of assets and strong financial health.
Debt Management: The company maintains a balanced debt approach with a debt-to-equity ratio below industry norms, standing at 0.22.
To track all earnings releases for Alamo Group visit their earnings calendar on our site.
This article was generated by Benzinga's automated content engine and reviewed by an editor.
Posted In: ALG


