A Preview Of Corporacion America's Earnings
Author: Benzinga Insights | May 21, 2025 10:01am
Corporacion America (NYSE:CAAP) will release its quarterly earnings report on Thursday, 2025-05-22. Here's a brief overview for investors ahead of the announcement.
Analysts anticipate Corporacion America to report an earnings per share (EPS) of $0.51.
Anticipation surrounds Corporacion America's announcement, with investors hoping to hear about both surpassing estimates and receiving positive guidance for the next quarter.
New investors should understand that while earnings performance is important, market reactions are often driven by guidance.
Earnings Track Record
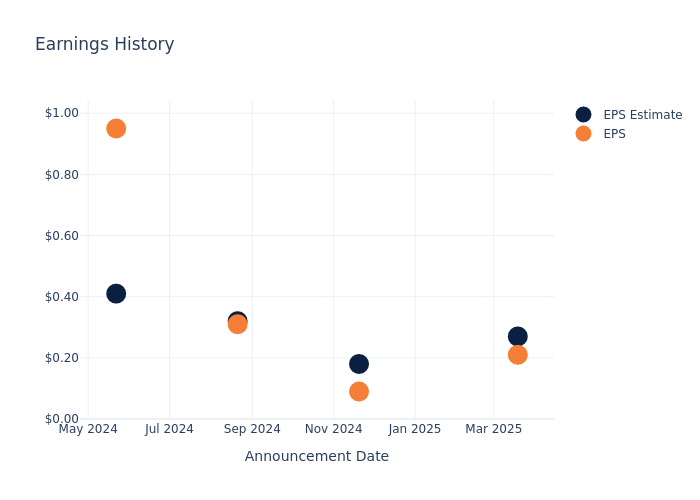
The company's EPS missed by $0.06 in the last quarter, leading to a 1.34% drop in the share price on the following day.
Here's a look at Corporacion America's past performance and the resulting price change:
| Quarter |
Q4 2024 |
Q3 2024 |
Q2 2024 |
Q1 2024 |
| EPS Estimate |
0.27 |
0.18 |
0.32 |
0.41 |
| EPS Actual |
0.21 |
0.09 |
0.31 |
0.95 |
| Price Change % |
-1.0% |
-7.000000000000001% |
-4.0% |
-4.0% |
Market Performance of Corporacion America's Stock
Shares of Corporacion America were trading at $21.84 as of May 20. Over the last 52-week period, shares are up 24.05%. Given that these returns are generally positive, long-term shareholders should be satisfied going into this earnings release.
Analyst Insights on Corporacion America
For investors, staying informed about market sentiments and expectations in the industry is paramount. This analysis provides an exploration of the latest insights on Corporacion America.
The consensus rating for Corporacion America is Outperform, based on 1 analyst ratings. With an average one-year price target of $22.5, there's a potential 3.02% upside.
Comparing Ratings Among Industry Peers
The following analysis focuses on the analyst ratings and average 1-year price targets of Central North Airport Gr and Sky Harbour Group, three prominent industry players, providing insights into their relative performance expectations and market positioning.
- Analysts currently favor an Buy trajectory for Central North Airport Gr, with an average 1-year price target of $106.0, suggesting a potential 385.35% upside.
- Analysts currently favor an Buy trajectory for Sky Harbour Group, with an average 1-year price target of $14.5, suggesting a potential 33.61% downside.
Snapshot: Peer Analysis
The peer analysis summary provides a snapshot of key metrics for Central North Airport Gr and Sky Harbour Group, illuminating their respective standings within the industry. These metrics offer valuable insights into their market positions and comparative performance.
| Company |
Consensus |
Revenue Growth |
Gross Profit |
Return on Equity |
| Corporacion America |
Outperform |
274.93% |
$146.60M |
2.76% |
| Central North Airport Gr |
Buy |
-4.96% |
$2.64B |
11.65% |
| Sky Harbour Group |
Buy |
132.65% |
$1.96M |
-6.30% |
Key Takeaway:
Corporacion America ranks at the top for Revenue Growth among its peers. It is at the bottom for Gross Profit and Return on Equity.
Delving into Corporacion America's Background
Corporacion America Airports SA acquires, develops, and operates airport concessions. Its operating segments are geographically divided into Argentina, Italy, Brazil, Uruguay, Ecuador, and Armenia. The company generates a majority of its revenue from the Argentina segment. The firm's revenue is categorized into Aeronautical Revenue, Non-Aeronautical Revenue, Commercial Revenue, Construction Service Revenue, and Other Revenue.
Corporacion America's Economic Impact: An Analysis
Market Capitalization: With restricted market capitalization, the company is positioned below industry averages. This reflects a smaller scale relative to peers.
Revenue Growth: Corporacion America displayed positive results in 3 months. As of 31 December, 2024, the company achieved a solid revenue growth rate of approximately 274.93%. This indicates a notable increase in the company's top-line earnings. As compared to competitors, the company surpassed expectations with a growth rate higher than the average among peers in the Industrials sector.
Net Margin: Corporacion America's financial strength is reflected in its exceptional net margin, which exceeds industry averages. With a remarkable net margin of 7.98%, the company showcases strong profitability and effective cost management.
Return on Equity (ROE): Corporacion America's ROE is below industry standards, pointing towards difficulties in efficiently utilizing equity capital. With an ROE of 2.76%, the company may encounter challenges in delivering satisfactory returns for shareholders.
Return on Assets (ROA): Corporacion America's ROA lags behind industry averages, suggesting challenges in maximizing returns from its assets. With an ROA of 0.9%, the company may face hurdles in achieving optimal financial performance.
Debt Management: Corporacion America's debt-to-equity ratio is below the industry average. With a ratio of 0.85, the company relies less on debt financing, maintaining a healthier balance between debt and equity, which can be viewed positively by investors.
To track all earnings releases for Corporacion America visit their earnings calendar on our site.
This article was generated by Benzinga's automated content engine and reviewed by an editor.
Posted In: CAAP


