Exploring Neogen's Earnings Expectations
Author: Benzinga Insights | July 28, 2025 03:02pm
Neogen (NASDAQ:NEOG) is gearing up to announce its quarterly earnings on Tuesday, 2025-07-29. Here's a quick overview of what investors should know before the release.
Analysts are estimating that Neogen will report an earnings per share (EPS) of $0.08.
Investors in Neogen are eagerly awaiting the company's announcement, hoping for news of surpassing estimates and positive guidance for the next quarter.
It's worth noting for new investors that stock prices can be heavily influenced by future projections rather than just past performance.
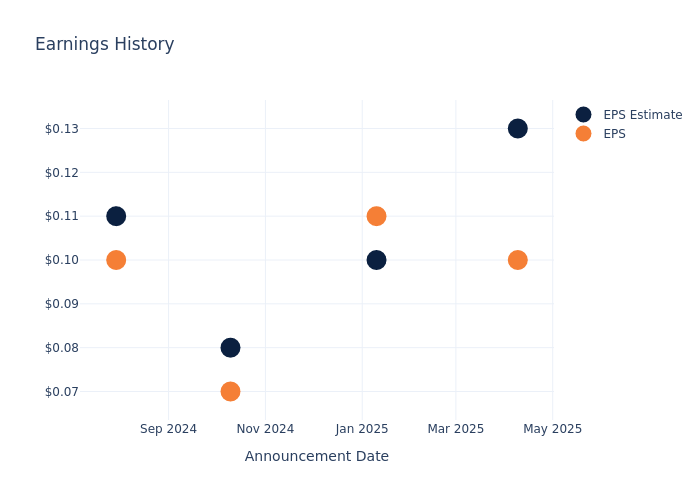
Overview of Past Earnings
Last quarter the company missed EPS by $0.03, which was followed by a 12.15% increase in the share price the next day.
Here's a look at Neogen's past performance and the resulting price change:
| Quarter |
Q3 2025 |
Q2 2025 |
Q1 2025 |
Q4 2024 |
| EPS Estimate |
0.13 |
0.10 |
0.08 |
0.11 |
| EPS Actual |
0.10 |
0.11 |
0.07 |
0.10 |
| Price Change % |
12.0% |
-5.0% |
5.0% |
-3.0% |
Market Performance of Neogen's Stock
Shares of Neogen were trading at $5.22 as of July 25. Over the last 52-week period, shares are down 69.2%. Given that these returns are generally negative, long-term shareholders are likely upset going into this earnings release.
Analyst Insights on Neogen
For investors, grasping market sentiments and expectations in the industry is vital. This analysis explores the latest insights regarding Neogen.
Neogen has received a total of 1 ratings from analysts, with the consensus rating as Buy. With an average one-year price target of $10.0, the consensus suggests a potential 91.57% upside.
Peer Ratings Comparison
The analysis below examines the analyst ratings and average 1-year price targets of Establishment Labs Hldgs, Staar Surgical and OrthoPediatrics, three significant industry players, providing valuable insights into their relative performance expectations and market positioning.
- Analysts currently favor an Buy trajectory for Establishment Labs Hldgs, with an average 1-year price target of $53.25, suggesting a potential 920.11% upside.
- Analysts currently favor an Neutral trajectory for Staar Surgical, with an average 1-year price target of $19.33, suggesting a potential 270.31% upside.
- Analysts currently favor an Buy trajectory for OrthoPediatrics, with an average 1-year price target of $36.0, suggesting a potential 589.66% upside.
Analysis Summary for Peers
The peer analysis summary presents essential metrics for Establishment Labs Hldgs, Staar Surgical and OrthoPediatrics, unveiling their respective standings within the industry and providing valuable insights into their market positions and comparative performance.
| Company |
Consensus |
Revenue Growth |
Gross Profit |
Return on Equity |
| Neogen |
Buy |
-3.42% |
$110.27M |
-0.41% |
| Establishment Labs Hldgs |
Buy |
11.33% |
$27.81M |
-45.20% |
| Staar Surgical |
Neutral |
-44.94% |
$28.00M |
-14.51% |
| OrthoPediatrics |
Buy |
17.29% |
$38.26M |
-3.04% |
Key Takeaway:
Neogen ranks at the top for Revenue Growth and Gross Profit among its peers. However, it ranks at the bottom for Return on Equity.
About Neogen
Neogen Corporation, headquartered in Lansing, Michigan, develops, manufactures, and markets various products for food and animal safety. In food safety, Neogen performs diagnostics to detect unintended substances in food and animal feed, such as pathogens, allergens, and drug residues, for food and feed processing companies. In animal safety, Neogen sells veterinary instruments, pharmaceuticals, disinfectants, and genomics tests for animals, including cattle, horses, and canines. Sales in the United States account for maximum revenue, and it also has its presence in United Kingdom and other countries.
Neogen's Economic Impact: An Analysis
Market Capitalization: With restricted market capitalization, the company is positioned below industry averages. This reflects a smaller scale relative to peers.
Negative Revenue Trend: Examining Neogen's financials over 3 months reveals challenges. As of 28 February, 2025, the company experienced a decline of approximately -3.42% in revenue growth, reflecting a decrease in top-line earnings. When compared to others in the Health Care sector, the company faces challenges, achieving a growth rate lower than the average among peers.
Net Margin: The company's net margin is a standout performer, exceeding industry averages. With an impressive net margin of -4.96%, the company showcases strong profitability and effective cost control.
Return on Equity (ROE): Neogen's ROE excels beyond industry benchmarks, reaching -0.41%. This signifies robust financial management and efficient use of shareholder equity capital.
Return on Assets (ROA): Neogen's ROA excels beyond industry benchmarks, reaching -0.27%. This signifies efficient management of assets and strong financial health.
Debt Management: With a below-average debt-to-equity ratio of 0.34, Neogen adopts a prudent financial strategy, indicating a balanced approach to debt management.
To track all earnings releases for Neogen visit their earnings calendar on our site.
This article was generated by Benzinga's automated content engine and reviewed by an editor.
Posted In: NEOG


