What's Next: Ocular Therapeutix's Earnings Preview
Author: Benzinga Insights | August 04, 2025 03:04pm
Ocular Therapeutix (NASDAQ:OCUL) will release its quarterly earnings report on Tuesday, 2025-08-05. Here's a brief overview for investors ahead of the announcement.
Analysts anticipate Ocular Therapeutix to report an earnings per share (EPS) of $-0.35.
The market awaits Ocular Therapeutix's announcement, with hopes high for news of surpassing estimates and providing upbeat guidance for the next quarter.
It's important for new investors to understand that guidance can be a significant driver of stock prices.
Performance in Previous Earnings
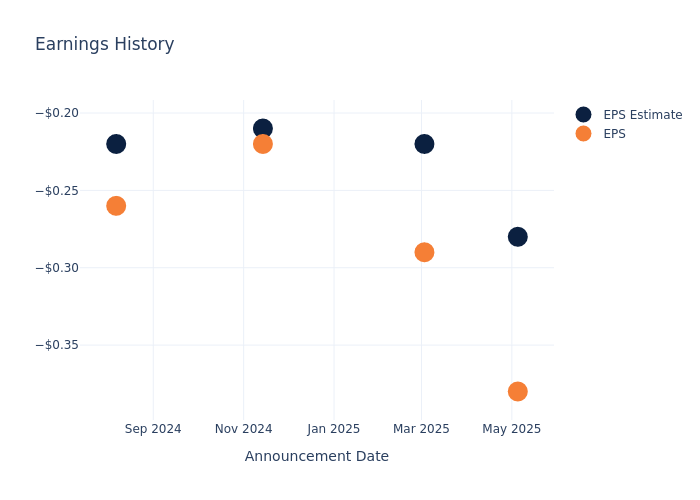
Last quarter the company missed EPS by $0.10, which was followed by a 7.18% drop in the share price the next day.
Here's a look at Ocular Therapeutix's past performance and the resulting price change:
| Quarter |
Q1 2025 |
Q4 2024 |
Q3 2024 |
Q2 2024 |
| EPS Estimate |
-0.28 |
-0.22 |
-0.21 |
-0.22 |
| EPS Actual |
-0.38 |
-0.29 |
-0.22 |
-0.26 |
| Price Change % |
-7.000000000000001% |
10.0% |
-8.0% |
-4.0% |
Performance of Ocular Therapeutix Shares
Shares of Ocular Therapeutix were trading at $11.92 as of August 01. Over the last 52-week period, shares are up 55.7%. Given that these returns are generally positive, long-term shareholders are likely bullish going into this earnings release.
Analysts' Perspectives on Ocular Therapeutix
For investors, grasping market sentiments and expectations in the industry is vital. This analysis explores the latest insights regarding Ocular Therapeutix.
The consensus rating for Ocular Therapeutix is Buy, derived from 2 analyst ratings. An average one-year price target of $14.5 implies a potential 21.64% upside.
Peer Ratings Overview
The below comparison of the analyst ratings and average 1-year price targets of Harmony Biosciences Hldgs and Tarsus Pharmaceuticals, three prominent players in the industry, gives insights for their relative performance expectations and market positioning.
- Analysts currently favor an Buy trajectory for Harmony Biosciences Hldgs, with an average 1-year price target of $51.67, suggesting a potential 333.47% upside.
- Analysts currently favor an Buy trajectory for Tarsus Pharmaceuticals, with an average 1-year price target of $72.0, suggesting a potential 504.03% upside.
Key Findings: Peer Analysis Summary
The peer analysis summary presents essential metrics for Harmony Biosciences Hldgs and Tarsus Pharmaceuticals, unveiling their respective standings within the industry and providing valuable insights into their market positions and comparative performance.
| Company |
Consensus |
Revenue Growth |
Gross Profit |
Return on Equity |
| Ocular Therapeutix |
Buy |
-27.59% |
$9.44M |
-22.04% |
| Harmony Biosciences Hldgs |
Buy |
19.48% |
$152.74M |
6.60% |
| Tarsus Pharmaceuticals |
Buy |
183.68% |
$73.12M |
-8.86% |
Key Takeaway:
Ocular Therapeutix ranks at the bottom for Revenue Growth and Gross Profit, while it is in the middle for Return on Equity.
Unveiling the Story Behind Ocular Therapeutix
Ocular Therapeutix Inc is a biotechnology company that specializes in therapies for diseases and conditions of the eye. The company uses its proprietary hydrogel platform technology to deliver therapeutic agents to the eye. Its pipeline consists of eye medication that aims to overcome the limitations of current eye-drop-based therapies for ophthalmic diseases and conditions. Its pipeline product includes Dextenza, OTX-TIC, OTX-TKI, and OTX-IVT.
Financial Milestones: Ocular Therapeutix's Journey
Market Capitalization Perspectives: The company's market capitalization falls below industry averages, signaling a relatively smaller size compared to peers. This positioning may be influenced by factors such as perceived growth potential or operational scale.
Decline in Revenue: Over the 3 months period, Ocular Therapeutix faced challenges, resulting in a decline of approximately -27.59% in revenue growth as of 31 March, 2025. This signifies a reduction in the company's top-line earnings. As compared to its peers, the revenue growth lags behind its industry peers. The company achieved a growth rate lower than the average among peers in Health Care sector.
Net Margin: The company's net margin is a standout performer, exceeding industry averages. With an impressive net margin of -598.74%, the company showcases strong profitability and effective cost control.
Return on Equity (ROE): Ocular Therapeutix's ROE is below industry averages, indicating potential challenges in efficiently utilizing equity capital. With an ROE of -22.04%, the company may face hurdles in achieving optimal financial returns.
Return on Assets (ROA): The company's ROA is below industry benchmarks, signaling potential difficulties in efficiently utilizing assets. With an ROA of -14.83%, the company may need to address challenges in generating satisfactory returns from its assets.
Debt Management: With a below-average debt-to-equity ratio of 0.29, Ocular Therapeutix adopts a prudent financial strategy, indicating a balanced approach to debt management.
To track all earnings releases for Ocular Therapeutix visit their earnings calendar on our site.
This article was generated by Benzinga's automated content engine and reviewed by an editor.
Posted In: OCUL


