Earnings Outlook For American Axle & Mfg Hldgs
Author: Benzinga Insights | August 07, 2025 10:04am
American Axle & Mfg Hldgs (NYSE:AXL) will release its quarterly earnings report on Friday, 2025-08-08. Here's a brief overview for investors ahead of the announcement.
Analysts anticipate American Axle & Mfg Hldgs to report an earnings per share (EPS) of $0.14.
The announcement from American Axle & Mfg Hldgs is eagerly anticipated, with investors seeking news of surpassing estimates and favorable guidance for the next quarter.
It's worth noting for new investors that guidance can be a key determinant of stock price movements.
Performance in Previous Earnings
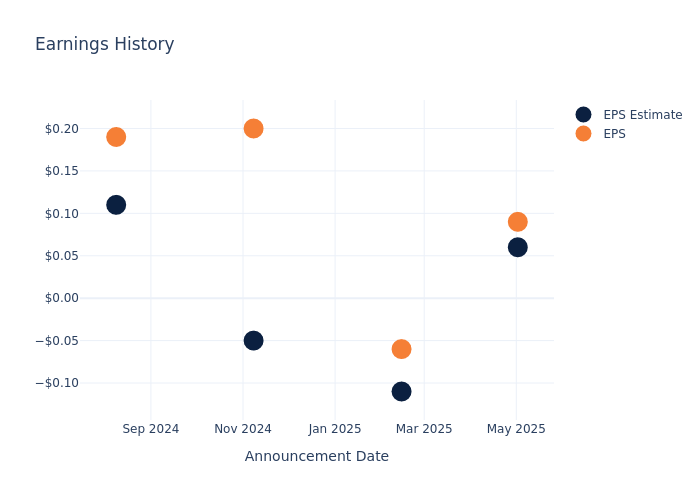
Last quarter the company beat EPS by $0.03, which was followed by a 0.0% drop in the share price the next day.
Here's a look at American Axle & Mfg Hldgs's past performance and the resulting price change:
| Quarter |
Q1 2025 |
Q4 2024 |
Q3 2024 |
Q2 2024 |
| EPS Estimate |
0.06 |
-0.11 |
-0.05 |
0.11 |
| EPS Actual |
0.09 |
-0.06 |
0.20 |
0.19 |
| Price Change % |
5.0% |
8.0% |
9.0% |
5.0% |
Market Performance of American Axle & Mfg Hldgs's Stock
Shares of American Axle & Mfg Hldgs were trading at $4.5 as of August 06. Over the last 52-week period, shares are down 30.18%. Given that these returns are generally negative, long-term shareholders are likely bearish going into this earnings release.
Analyst Observations about American Axle & Mfg Hldgs
For investors, grasping market sentiments and expectations in the industry is vital. This analysis explores the latest insights regarding American Axle & Mfg Hldgs.
A total of 2 analyst ratings have been received for American Axle & Mfg Hldgs, with the consensus rating being Buy. The average one-year price target stands at $7.25, suggesting a potential 61.11% upside.
Understanding Analyst Ratings Among Peers
In this comparison, we explore the analyst ratings and average 1-year price targets of Holley, Gentherm and Fox Factory Holding, three prominent industry players, offering insights into their relative performance expectations and market positioning.
- Analysts currently favor an Outperform trajectory for Holley, with an average 1-year price target of $3.58, suggesting a potential 20.44% downside.
- Analysts currently favor an Neutral trajectory for Gentherm, with an average 1-year price target of $36.5, suggesting a potential 711.11% upside.
- Analysts currently favor an Buy trajectory for Fox Factory Holding, with an average 1-year price target of $34.0, suggesting a potential 655.56% upside.
Peers Comparative Analysis Summary
In the peer analysis summary, key metrics for Holley, Gentherm and Fox Factory Holding are highlighted, providing an understanding of their respective standings within the industry and offering insights into their market positions and comparative performance.
| Company |
Consensus |
Revenue Growth |
Gross Profit |
Return on Equity |
| American Axle & Mfg Hldgs |
Buy |
-12.17% |
$173.90M |
1.17% |
| Holley |
Outperform |
-3.53% |
$64.09M |
0.67% |
| Gentherm |
Neutral |
-0.16% |
$89.76M |
0.07% |
| Fox Factory Holding |
Buy |
6.46% |
$109.68M |
-24.26% |
Key Takeaway:
American Axle & Mfg Hldgs ranks at the bottom for Revenue Growth among its peers. It is in the middle for Gross Profit. For Return on Equity, it is at the top.
Delving into American Axle & Mfg Hldgs's Background
American Axle & Mfg Holdings Inc is engaged in manufacturing, engineering, designing, and validation of driveline systems and related components and chassis modules for light trucks, SUVs, crossover vehicles, passenger cars, and commercial vehicles. The company's segment includes Driveline and Metal Forming. It generates maximum revenue from the Driveline segment.
Key Indicators: American Axle & Mfg Hldgs's Financial Health
Market Capitalization Analysis: Below industry benchmarks, the company's market capitalization reflects a smaller scale relative to peers. This could be attributed to factors such as growth expectations or operational capacity.
Revenue Challenges: American Axle & Mfg Hldgs's revenue growth over 3 months faced difficulties. As of 31 March, 2025, the company experienced a decline of approximately -12.17%. This indicates a decrease in top-line earnings. As compared to its peers, the revenue growth lags behind its industry peers. The company achieved a growth rate lower than the average among peers in Consumer Discretionary sector.
Net Margin: American Axle & Mfg Hldgs's net margin is impressive, surpassing industry averages. With a net margin of 0.48%, the company demonstrates strong profitability and effective cost management.
Return on Equity (ROE): The company's ROE is a standout performer, exceeding industry averages. With an impressive ROE of 1.17%, the company showcases effective utilization of equity capital.
Return on Assets (ROA): American Axle & Mfg Hldgs's ROA surpasses industry standards, highlighting the company's exceptional financial performance. With an impressive 0.13% ROA, the company effectively utilizes its assets for optimal returns.
Debt Management: American Axle & Mfg Hldgs's debt-to-equity ratio is notably higher than the industry average. With a ratio of 4.58, the company relies more heavily on borrowed funds, indicating a higher level of financial risk.
To track all earnings releases for American Axle & Mfg Hldgs visit their earnings calendar on our site.
This article was generated by Benzinga's automated content engine and reviewed by an editor.
Posted In: AXL


