What 7 Analyst Ratings Have To Say About Performance Food Gr
Author: Benzinga Insights | September 02, 2025 05:01pm
In the preceding three months, 7 analysts have released ratings for Performance Food Gr (NYSE:PFGC), presenting a wide array of perspectives from bullish to bearish.
The following table summarizes their recent ratings, shedding light on the changing sentiments within the past 30 days and comparing them to the preceding months.
|
Bullish |
Somewhat Bullish |
Indifferent |
Somewhat Bearish |
Bearish |
| Total Ratings |
3 |
3 |
1 |
0 |
0 |
| Last 30D |
0 |
1 |
0 |
0 |
0 |
| 1M Ago |
3 |
2 |
0 |
0 |
0 |
| 2M Ago |
0 |
0 |
1 |
0 |
0 |
| 3M Ago |
0 |
0 |
0 |
0 |
0 |
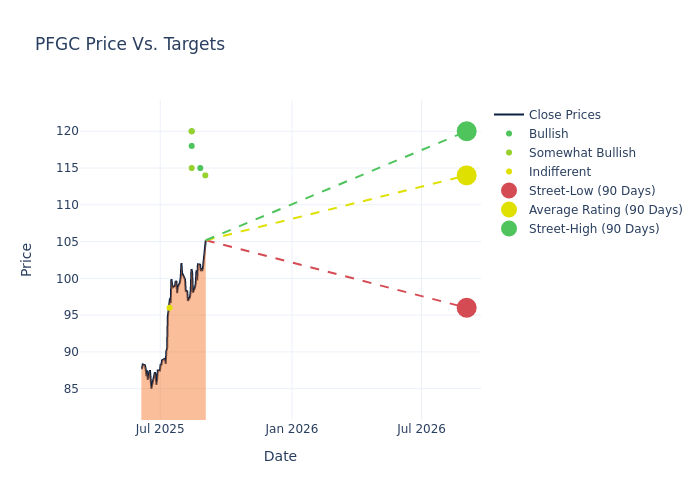
Analysts have set 12-month price targets for Performance Food Gr, revealing an average target of $114.0, a high estimate of $120.00, and a low estimate of $96.00. Witnessing a positive shift, the current average has risen by 10.68% from the previous average price target of $103.00.
Decoding Analyst Ratings: A Detailed Look
The perception of Performance Food Gr by financial experts is analyzed through recent analyst actions. The following summary presents key analysts, their recent evaluations, and adjustments to ratings and price targets.
| Analyst |
Analyst Firm |
Action Taken |
Rating |
Current Price Target |
Prior Price Target |
| Brian Mullan |
Piper Sandler |
Raises |
Overweight |
$114.00 |
$90.00 |
| John Heinbockel |
Guggenheim |
Maintains |
Buy |
$115.00 |
$115.00 |
| Jake Bartlett |
Truist Securities |
Raises |
Buy |
$118.00 |
$101.00 |
| Jeffrey Bernstein |
Barclays |
Raises |
Overweight |
$120.00 |
$112.00 |
| Mark Carden |
UBS |
Raises |
Buy |
$120.00 |
$110.00 |
| Edward Kelly |
Wells Fargo |
Raises |
Overweight |
$115.00 |
$100.00 |
| Brian Harbour |
Morgan Stanley |
Raises |
Equal-Weight |
$96.00 |
$93.00 |
Key Insights:
- Action Taken: In response to dynamic market conditions and company performance, analysts update their recommendations. Whether they 'Maintain', 'Raise', or 'Lower' their stance, it signifies their reaction to recent developments related to Performance Food Gr. This insight gives a snapshot of analysts' perspectives on the current state of the company.
- Rating: Delving into assessments, analysts assign qualitative values, from 'Outperform' to 'Underperform'. These ratings communicate expectations for the relative performance of Performance Food Gr compared to the broader market.
- Price Targets: Understanding forecasts, analysts offer estimates for Performance Food Gr's future value. Examining the current and prior targets provides insight into analysts' changing expectations.
Navigating through these analyst evaluations alongside other financial indicators can contribute to a holistic understanding of Performance Food Gr's market standing. Stay informed and make data-driven decisions with our Ratings Table.
Stay up to date on Performance Food Gr analyst ratings.
Delving into Performance Food Gr's Background
Performance Food Group Co , markets and distributes national and company-branded food and food-related products. The company also specializes in distributing candy, snacks, beverages, cigarettes, other tobacco products, health and beauty care products and other items to vending distributors, box retailers, theaters, convenience stores, drug stores, grocery stores, travel providers, and hospitality providers. The company has three reportable segments: Foodservice, Vistar, and Convenience.
Unraveling the Financial Story of Performance Food Gr
Market Capitalization Analysis: With an elevated market capitalization, the company stands out above industry averages, showcasing substantial size and market acknowledgment.
Revenue Growth: Performance Food Gr's revenue growth over a period of 3M has been noteworthy. As of 30 June, 2025, the company achieved a revenue growth rate of approximately 11.52%. This indicates a substantial increase in the company's top-line earnings. When compared to others in the Consumer Staples sector, the company excelled with a growth rate higher than the average among peers.
Net Margin: Performance Food Gr's net margin falls below industry averages, indicating challenges in achieving strong profitability. With a net margin of 0.78%, the company may face hurdles in effective cost management.
Return on Equity (ROE): Performance Food Gr's ROE is below industry averages, indicating potential challenges in efficiently utilizing equity capital. With an ROE of 2.99%, the company may face hurdles in achieving optimal financial returns.
Return on Assets (ROA): Performance Food Gr's ROA is below industry standards, pointing towards difficulties in efficiently utilizing assets. With an ROA of 0.75%, the company may encounter challenges in delivering satisfactory returns from its assets.
Debt Management: With a below-average debt-to-equity ratio of 1.79, Performance Food Gr adopts a prudent financial strategy, indicating a balanced approach to debt management.
Understanding the Relevance of Analyst Ratings
Benzinga tracks 150 analyst firms and reports on their stock expectations. Analysts typically arrive at their conclusions by predicting how much money a company will make in the future, usually the upcoming five years, and how risky or predictable that company's revenue streams are.
Analysts attend company conference calls and meetings, research company financial statements, and communicate with insiders to publish their ratings on stocks. Analysts typically rate each stock once per quarter or whenever the company has a major update.
Analysts may enhance their evaluations by incorporating forecasts for metrics like growth estimates, earnings, and revenue, delivering additional guidance to investors. It is vital to acknowledge that, although experts in stocks and sectors, analysts are human and express their opinions when providing insights.
Breaking: Wall Street's Next Big Mover
Benzinga's #1 analyst just identified a stock poised for explosive growth. This under-the-radar company could surge 200%+ as major market shifts unfold. Click here for urgent details.
This article was generated by Benzinga's automated content engine and reviewed by an editor.
Posted In: PFGC