4 Analysts Have This To Say About Casey's General Stores
Author: Benzinga Insights | September 09, 2025 03:01pm
Across the recent three months, 4 analysts have shared their insights on Casey's General Stores (NASDAQ:CASY), expressing a variety of opinions spanning from bullish to bearish.
The table below summarizes their recent ratings, showcasing the evolving sentiments within the past 30 days and comparing them to the preceding months.
|
Bullish |
Somewhat Bullish |
Indifferent |
Somewhat Bearish |
Bearish |
| Total Ratings |
1 |
2 |
1 |
0 |
0 |
| Last 30D |
1 |
1 |
0 |
0 |
0 |
| 1M Ago |
0 |
0 |
0 |
0 |
0 |
| 2M Ago |
0 |
1 |
0 |
0 |
0 |
| 3M Ago |
0 |
0 |
1 |
0 |
0 |
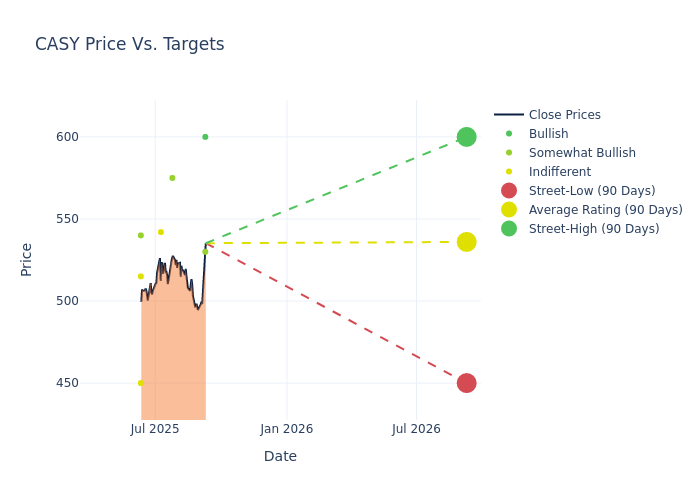
The 12-month price targets assessed by analysts reveal further insights, featuring an average target of $561.75, a high estimate of $600.00, and a low estimate of $530.00. Surpassing the previous average price target of $530.75, the current average has increased by 5.84%.
Investigating Analyst Ratings: An Elaborate Study
The perception of Casey's General Stores by financial experts is analyzed through recent analyst actions. The following summary presents key analysts, their recent evaluations, and adjustments to ratings and price targets.
| Analyst |
Analyst Firm |
Action Taken |
Rating |
Current Price Target |
Prior Price Target |
| Corey Tarlowe |
Jefferies |
Raises |
Buy |
$600.00 |
$575.00 |
| Pooran Sharma |
Stephens & Co. |
Maintains |
Overweight |
$530.00 |
$530.00 |
| Bradley Thomas |
Keybanc |
Raises |
Overweight |
$575.00 |
$550.00 |
| Irene Nattel |
RBC Capital |
Raises |
Sector Perform |
$542.00 |
$468.00 |
Key Insights:
- Action Taken: Analysts respond to changes in market conditions and company performance, frequently updating their recommendations. Whether they 'Maintain', 'Raise' or 'Lower' their stance, it reflects their reaction to recent developments related to Casey's General Stores. This information offers a snapshot of how analysts perceive the current state of the company.
- Rating: Analysts unravel qualitative evaluations for stocks, ranging from 'Outperform' to 'Underperform'. These ratings offer insights into expectations for the relative performance of Casey's General Stores compared to the broader market.
- Price Targets: Analysts set price targets as an estimate of a stock's future value. Comparing the current and prior price targets provides insight into how analysts' expectations have changed over time. This information can be valuable for investors seeking to understand consensus views on the stock's potential future performance.
To gain a panoramic view of Casey's General Stores's market performance, explore these analyst evaluations alongside essential financial indicators. Stay informed and make judicious decisions using our Ratings Table.
Stay up to date on Casey's General Stores analyst ratings.
Delving into Casey's General Stores's Background
Casey's General Stores Inc serves as convenience store chain with its 2,900 locations, positioned in the Midwest United States. About half of Casey's stores are located in rural towns with populations under 5,000. While fueling stations serve as a key traffic driver, about two-thirds of the company's gross profit stems from in-store sales of grocery items, prepared meals, and general merchandise. Casey's owns more than 90% of its stores and operates the majority of its warehousing and distribution processes internally.
Key Indicators: Casey's General Stores's Financial Health
Market Capitalization Analysis: The company's market capitalization surpasses industry averages, showcasing a dominant size relative to peers and suggesting a strong market position.
Revenue Growth: Casey's General Stores displayed positive results in 3M. As of 30 April, 2025, the company achieved a solid revenue growth rate of approximately 10.91%. This indicates a notable increase in the company's top-line earnings. As compared to its peers, the revenue growth lags behind its industry peers. The company achieved a growth rate lower than the average among peers in Consumer Staples sector.
Net Margin: The company's net margin is a standout performer, exceeding industry averages. With an impressive net margin of 2.46%, the company showcases strong profitability and effective cost control.
Return on Equity (ROE): Casey's General Stores's ROE stands out, surpassing industry averages. With an impressive ROE of 2.84%, the company demonstrates effective use of equity capital and strong financial performance.
Return on Assets (ROA): Casey's General Stores's financial strength is reflected in its exceptional ROA, which exceeds industry averages. With a remarkable ROA of 1.2%, the company showcases efficient use of assets and strong financial health.
Debt Management: Casey's General Stores's debt-to-equity ratio is below industry norms, indicating a sound financial structure with a ratio of 0.84.
What Are Analyst Ratings?
Analysts work in banking and financial systems and typically specialize in reporting for stocks or defined sectors. Analysts may attend company conference calls and meetings, research company financial statements, and communicate with insiders to publish "analyst ratings" for stocks. Analysts typically rate each stock once per quarter.
Beyond their standard evaluations, some analysts contribute predictions for metrics like growth estimates, earnings, and revenue, furnishing investors with additional guidance. Users of analyst ratings should be mindful that this specialized advice is shaped by human perspectives and may be subject to variability.
Breaking: Wall Street's Next Big Mover
Benzinga's #1 analyst just identified a stock poised for explosive growth. This under-the-radar company could surge 200%+ as major market shifts unfold. Click here for urgent details.
This article was generated by Benzinga's automated content engine and reviewed by an editor.
Posted In: CASY


