Where Asbury Automotive Group Stands With Analysts
Author: Benzinga Insights | September 10, 2025 03:05pm
Throughout the last three months, 7 analysts have evaluated Asbury Automotive Group (NYSE:ABG), offering a diverse set of opinions from bullish to bearish.
The table below provides a concise overview of recent ratings by analysts, offering insights into the changing sentiments over the past 30 days and drawing comparisons with the preceding months for a holistic perspective.
|
Bullish |
Somewhat Bullish |
Indifferent |
Somewhat Bearish |
Bearish |
| Total Ratings |
2 |
1 |
2 |
2 |
0 |
| Last 30D |
1 |
0 |
0 |
0 |
0 |
| 1M Ago |
0 |
1 |
1 |
0 |
0 |
| 2M Ago |
0 |
0 |
1 |
2 |
0 |
| 3M Ago |
1 |
0 |
0 |
0 |
0 |
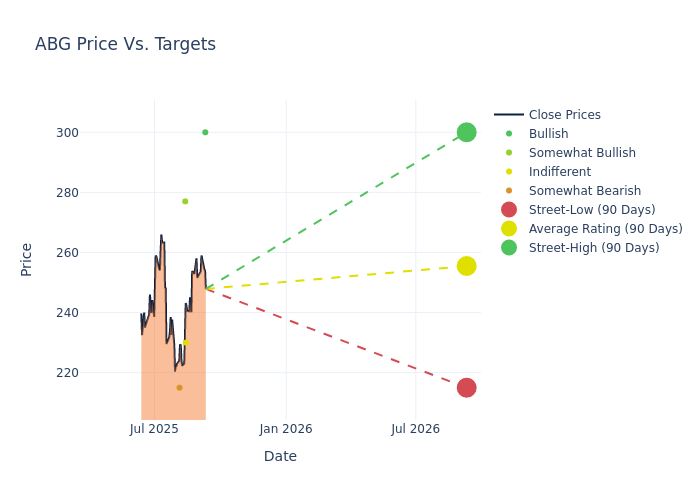
Providing deeper insights, analysts have established 12-month price targets, indicating an average target of $258.14, along with a high estimate of $335.00 and a low estimate of $215.00. Observing a 0.11% increase, the current average has risen from the previous average price target of $257.86.
Decoding Analyst Ratings: A Detailed Look
The analysis of recent analyst actions sheds light on the perception of Asbury Automotive Group by financial experts. The following summary presents key analysts, their recent evaluations, and adjustments to ratings and price targets.
| Analyst |
Analyst Firm |
Action Taken |
Rating |
Current Price Target |
Prior Price Target |
| John Murphy |
B of A Securities |
Lowers |
Buy |
$300.00 |
$335.00 |
| Adam Jonas |
Morgan Stanley |
Raises |
Equal-Weight |
$230.00 |
$225.00 |
| Jeff Lick |
Stephens & Co. |
Raises |
Overweight |
$277.00 |
$225.00 |
| Rajat Gupta |
JP Morgan |
Lowers |
Underweight |
$215.00 |
$225.00 |
| Jeff Lick |
Stephens & Co. |
Lowers |
Equal-Weight |
$225.00 |
$235.00 |
| Rajat Gupta |
JP Morgan |
Lowers |
Underweight |
$225.00 |
$235.00 |
| John Murphy |
B of A Securities |
Raises |
Buy |
$335.00 |
$325.00 |
Key Insights:
- Action Taken: Analysts respond to changes in market conditions and company performance, frequently updating their recommendations. Whether they 'Maintain', 'Raise' or 'Lower' their stance, it reflects their reaction to recent developments related to Asbury Automotive Group. This information offers a snapshot of how analysts perceive the current state of the company.
- Rating: Offering a comprehensive view, analysts assess stocks qualitatively, spanning from 'Outperform' to 'Underperform'. These ratings convey expectations for the relative performance of Asbury Automotive Group compared to the broader market.
- Price Targets: Delving into movements, analysts provide estimates for the future value of Asbury Automotive Group's stock. This analysis reveals shifts in analysts' expectations over time.
Understanding these analyst evaluations alongside key financial indicators can offer valuable insights into Asbury Automotive Group's market standing. Stay informed and make well-considered decisions with our Ratings Table.
Stay up to date on Asbury Automotive Group analyst ratings.
About Asbury Automotive Group
Asbury Automotive Group is a regional collection of automobile dealerships that went public in March 2002. The company operates 152 new-vehicle stores and 37 collision centers. Over 70% of new-vehicle revenue is from luxury and import brands. Asbury also offers third-party financing and insurance products and its own F&I products via Total Care Auto. Asbury operates in 14 states (mostly Texas, the West, the Mid-Atlantic, and the Southeast). Asbury store brands include McDavid and Park Place in Texas, Koons in the Washington, D.C. area, and the Larry H. Miller brand in the Western US. Asbury generated $17.2 billion of revenue in 2024 and is based in the Atlanta area. The firm targets at least $30 billion of revenue sometime around 2030.
Understanding the Numbers: Asbury Automotive Group's Finances
Market Capitalization Analysis: Reflecting a smaller scale, the company's market capitalization is positioned below industry averages. This could be attributed to factors such as growth expectations or operational capacity.
Revenue Growth: Asbury Automotive Group's remarkable performance in 3M is evident. As of 30 June, 2025, the company achieved an impressive revenue growth rate of 2.99%. This signifies a substantial increase in the company's top-line earnings. In comparison to its industry peers, the company trails behind with a growth rate lower than the average among peers in the Consumer Discretionary sector.
Net Margin: Asbury Automotive Group's financial strength is reflected in its exceptional net margin, which exceeds industry averages. With a remarkable net margin of 3.49%, the company showcases strong profitability and effective cost management.
Return on Equity (ROE): Asbury Automotive Group's ROE is below industry standards, pointing towards difficulties in efficiently utilizing equity capital. With an ROE of 4.13%, the company may encounter challenges in delivering satisfactory returns for shareholders.
Return on Assets (ROA): Asbury Automotive Group's financial strength is reflected in its exceptional ROA, which exceeds industry averages. With a remarkable ROA of 1.5%, the company showcases efficient use of assets and strong financial health.
Debt Management: With a below-average debt-to-equity ratio of 1.21, Asbury Automotive Group adopts a prudent financial strategy, indicating a balanced approach to debt management.
Analyst Ratings: Simplified
Benzinga tracks 150 analyst firms and reports on their stock expectations. Analysts typically arrive at their conclusions by predicting how much money a company will make in the future, usually the upcoming five years, and how risky or predictable that company's revenue streams are.
Analysts attend company conference calls and meetings, research company financial statements, and communicate with insiders to publish their ratings on stocks. Analysts typically rate each stock once per quarter or whenever the company has a major update.
Beyond their standard evaluations, some analysts contribute predictions for metrics like growth estimates, earnings, and revenue, furnishing investors with additional guidance. Users of analyst ratings should be mindful that this specialized advice is shaped by human perspectives and may be subject to variability.
Which Stocks Are Analysts Recommending Now?
Benzinga Edge gives you instant access to all major analyst upgrades, downgrades, and price targets. Sort by accuracy, upside potential, and more. Click here to stay ahead of the market.
This article was generated by Benzinga's automated content engine and reviewed by an editor.
Posted In: ABG


