What Analysts Are Saying About Tronox Holdings Stock
Author: Benzinga Insights | October 03, 2025 07:01am
Tronox Holdings (NYSE:TROX) has been analyzed by 7 analysts in the last three months, revealing a diverse range of perspectives from bullish to bearish.
In the table below, you'll find a summary of their recent ratings, revealing the shifting sentiments over the past 30 days and comparing them to the previous months.
|
Bullish |
Somewhat Bullish |
Indifferent |
Somewhat Bearish |
Bearish |
| Total Ratings |
3 |
0 |
3 |
1 |
0 |
| Last 30D |
0 |
0 |
0 |
0 |
0 |
| 1M Ago |
1 |
0 |
0 |
1 |
0 |
| 2M Ago |
1 |
0 |
2 |
0 |
0 |
| 3M Ago |
1 |
0 |
1 |
0 |
0 |
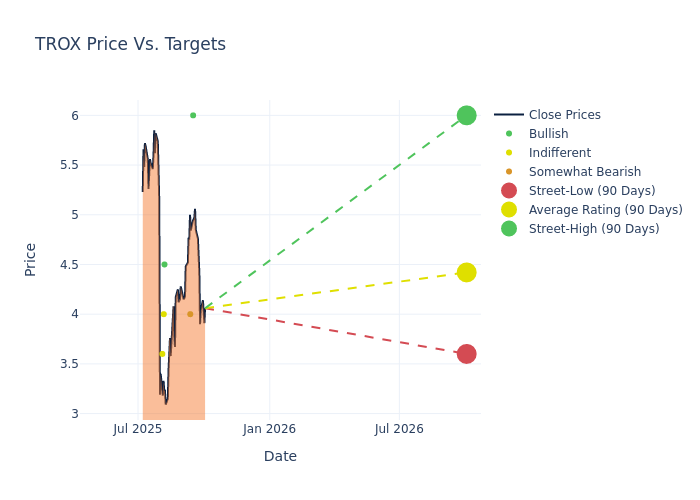
The 12-month price targets assessed by analysts reveal further insights, featuring an average target of $5.01, a high estimate of $8.00, and a low estimate of $3.60. Observing a downward trend, the current average is 29.24% lower than the prior average price target of $7.08.
Breaking Down Analyst Ratings: A Detailed Examination
The standing of Tronox Holdings among financial experts becomes clear with a thorough analysis of recent analyst actions. The summary below outlines key analysts, their recent evaluations, and adjustments to ratings and price targets.
| Analyst |
Analyst Firm |
Action Taken |
Rating |
Current Price Target |
Prior Price Target |
| Peter Osterland |
Truist Securities |
Raises |
Buy |
$6.00 |
$5.00 |
| John Roberts |
Mizuho |
Announces |
Underperform |
$4.00 |
- |
| Duffy Fischer |
Goldman Sachs |
Lowers |
Buy |
$4.50 |
$7.00 |
| Vincent Andrews |
Morgan Stanley |
Lowers |
Equal-Weight |
$4.00 |
$8.00 |
| Joshua Spector |
UBS |
Lowers |
Neutral |
$3.60 |
$8.00 |
| John Roberts |
Mizuho |
Lowers |
Neutral |
$5.00 |
$6.00 |
| Joshua Spector |
UBS |
Lowers |
Buy |
$8.00 |
$8.50 |
Key Insights:
- Action Taken: Responding to changing market dynamics and company performance, analysts update their recommendations. Whether they 'Maintain', 'Raise', or 'Lower' their stance, it signifies their response to recent developments related to Tronox Holdings. This offers insight into analysts' perspectives on the current state of the company.
- Rating: Unveiling insights, analysts deliver qualitative insights into stock performance, from 'Outperform' to 'Underperform'. These ratings convey expectations for the relative performance of Tronox Holdings compared to the broader market.
- Price Targets: Gaining insights, analysts provide estimates for the future value of Tronox Holdings's stock. This comparison reveals trends in analysts' expectations over time.
Assessing these analyst evaluations alongside crucial financial indicators can provide a comprehensive overview of Tronox Holdings's market position. Stay informed and make well-judged decisions with the assistance of our Ratings Table.
Stay up to date on Tronox Holdings analyst ratings.
If you are interested in following small-cap stock news and performance you can start by tracking it here.
Get to Know Tronox Holdings Better
Tronox Holdings PLC is a vertically integrated manufacturer of TiO2 pigment. It operates titanium-bearing mineral sand mines and beneficiation and smelting operations in Australia & South Africa to produce feedstock materials that can be processed into TiO2 for pigment, high-purity titanium chemicals, including titanium tetrachloride, and ultrafine TiO2 used in certain specialty applications. TiO2 and titanium feedstock, are used to produce paints and coatings, as well as plastics, paper, and printing ink. It has three pigment production facilities in the United States, the Netherlands, and Western Australia and three mining operations in Western Australia and South Africa. Europe, the Middle East, and Africa regions contribute the majority of revenue.
Tronox Holdings: Financial Performance Dissected
Market Capitalization: With restricted market capitalization, the company is positioned below industry averages. This reflects a smaller scale relative to peers.
Revenue Challenges: Tronox Holdings's revenue growth over 3M faced difficulties. As of 30 June, 2025, the company experienced a decline of approximately -10.85%. This indicates a decrease in top-line earnings. As compared to competitors, the company encountered difficulties, with a growth rate lower than the average among peers in the Materials sector.
Net Margin: Tronox Holdings's financial strength is reflected in its exceptional net margin, which exceeds industry averages. With a remarkable net margin of -11.49%, the company showcases strong profitability and effective cost management.
Return on Equity (ROE): Tronox Holdings's ROE falls below industry averages, indicating challenges in efficiently using equity capital. With an ROE of -5.06%, the company may face hurdles in generating optimal returns for shareholders.
Return on Assets (ROA): Tronox Holdings's ROA falls below industry averages, indicating challenges in efficiently utilizing assets. With an ROA of -1.37%, the company may face hurdles in generating optimal returns from its assets.
Debt Management: The company faces challenges in debt management with a debt-to-equity ratio higher than the industry average. With a ratio of 1.94, caution is advised due to increased financial risk.
What Are Analyst Ratings?
Ratings come from analysts, or specialists within banking and financial systems that report for specific stocks or defined sectors (typically once per quarter for each stock). Analysts usually derive their information from company conference calls and meetings, financial statements, and conversations with important insiders to reach their decisions.
Some analysts also offer predictions for helpful metrics such as earnings, revenue, and growth estimates to provide further guidance as to what to do with certain tickers. It is important to keep in mind that while stock and sector analysts are specialists, they are also human and can only forecast their beliefs to traders.
Which Stocks Are Analysts Recommending Now?
Benzinga Edge gives you instant access to all major analyst upgrades, downgrades, and price targets. Sort by accuracy, upside potential, and more. Click here to stay ahead of the market.
This article was generated by Benzinga's automated content engine and reviewed by an editor.
Posted In: TROX


