Breaking Down Range Resources: 12 Analysts Share Their Views
Author: Benzinga Insights | October 06, 2025 08:01am
Range Resources (NYSE:RRC) has been analyzed by 12 analysts in the last three months, revealing a diverse range of perspectives from bullish to bearish.
Summarizing their recent assessments, the table below illustrates the evolving sentiments in the past 30 days and compares them to the preceding months.
|
Bullish |
Somewhat Bullish |
Indifferent |
Somewhat Bearish |
Bearish |
| Total Ratings |
0 |
3 |
9 |
0 |
0 |
| Last 30D |
0 |
0 |
1 |
0 |
0 |
| 1M Ago |
0 |
2 |
1 |
0 |
0 |
| 2M Ago |
0 |
0 |
3 |
0 |
0 |
| 3M Ago |
0 |
1 |
4 |
0 |
0 |
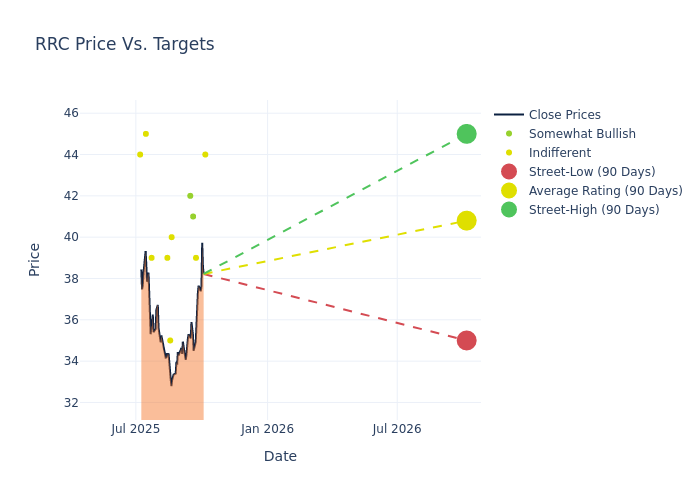
Analysts provide deeper insights through their assessments of 12-month price targets, revealing an average target of $41.25, a high estimate of $48.00, and a low estimate of $35.00. This current average represents a 3.51% decrease from the previous average price target of $42.75.
Deciphering Analyst Ratings: An In-Depth Analysis
In examining recent analyst actions, we gain insights into how financial experts perceive Range Resources. The following summary outlines key analysts, their recent evaluations, and adjustments to ratings and price targets.
| Analyst |
Analyst Firm |
Action Taken |
Rating |
Current Price Target |
Prior Price Target |
| Arun Jayaram |
JP Morgan |
Lowers |
Neutral |
$44.00 |
$46.00 |
| Paul Diamond |
Citigroup |
Lowers |
Neutral |
$39.00 |
$40.00 |
| John Freeman |
Raymond James |
Lowers |
Outperform |
$41.00 |
$45.00 |
| Nitin Kumar |
Mizuho |
Lowers |
Outperform |
$42.00 |
$48.00 |
| Josh Silverstein |
UBS |
Lowers |
Neutral |
$40.00 |
$42.00 |
| Leo Mariani |
Roth Capital |
Lowers |
Neutral |
$35.00 |
$44.00 |
| Mark Lear |
Piper Sandler |
Lowers |
Neutral |
$39.00 |
$41.00 |
| Josh Silverstein |
UBS |
Raises |
Neutral |
$42.00 |
$40.00 |
| Mark Lear |
Piper Sandler |
Raises |
Neutral |
$41.00 |
$40.00 |
| Nitin Kumar |
Mizuho |
Raises |
Outperform |
$48.00 |
$46.00 |
| Biju Perincheril |
Susquehanna |
Raises |
Neutral |
$39.00 |
$36.00 |
| Scott Hanold |
RBC Capital |
Maintains |
Sector Perform |
$45.00 |
$45.00 |
Key Insights:
- Action Taken: Analysts respond to changes in market conditions and company performance, frequently updating their recommendations. Whether they 'Maintain', 'Raise' or 'Lower' their stance, it reflects their reaction to recent developments related to Range Resources. This information offers a snapshot of how analysts perceive the current state of the company.
- Rating: Delving into assessments, analysts assign qualitative values, from 'Outperform' to 'Underperform'. These ratings communicate expectations for the relative performance of Range Resources compared to the broader market.
- Price Targets: Analysts provide insights into price targets, offering estimates for the future value of Range Resources's stock. This comparison reveals trends in analysts' expectations over time.
Understanding these analyst evaluations alongside key financial indicators can offer valuable insights into Range Resources's market standing. Stay informed and make well-considered decisions with our Ratings Table.
Stay up to date on Range Resources analyst ratings.
Get to Know Range Resources Better
Fort Worth-based Range Resources is an independent exploration and production company with that focuses entirely on its operations in the Marcellus Shale in Pennsylvania. At year-end 2024, Range Resources' proven reserves totaled 18.1 trillion cubic feet equivalent, with net production of 2.18 billion cubic feet equivalent per day. Natural gas accounted for 68% of production.
Understanding the Numbers: Range Resources's Finances
Market Capitalization Analysis: Positioned below industry benchmarks, the company's market capitalization faces constraints in size. This could be influenced by factors such as growth expectations or operational capacity.
Revenue Growth: Over the 3M period, Range Resources showcased positive performance, achieving a revenue growth rate of 37.23% as of 30 June, 2025. This reflects a substantial increase in the company's top-line earnings. In comparison to its industry peers, the company trails behind with a growth rate lower than the average among peers in the Energy sector.
Net Margin: Range Resources's net margin surpasses industry standards, highlighting the company's exceptional financial performance. With an impressive 33.87% net margin, the company effectively manages costs and achieves strong profitability.
Return on Equity (ROE): The company's ROE is a standout performer, exceeding industry averages. With an impressive ROE of 5.88%, the company showcases effective utilization of equity capital.
Return on Assets (ROA): Range Resources's ROA surpasses industry standards, highlighting the company's exceptional financial performance. With an impressive 3.27% ROA, the company effectively utilizes its assets for optimal returns.
Debt Management: Range Resources's debt-to-equity ratio is below the industry average. With a ratio of 0.34, the company relies less on debt financing, maintaining a healthier balance between debt and equity, which can be viewed positively by investors.
How Are Analyst Ratings Determined?
Analysts are specialists within banking and financial systems that typically report for specific stocks or within defined sectors. These people research company financial statements, sit in conference calls and meetings, and speak with relevant insiders to determine what are known as analyst ratings for stocks. Typically, analysts will rate each stock once a quarter.
Some analysts publish their predictions for metrics such as growth estimates, earnings, and revenue to provide additional guidance with their ratings. When using analyst ratings, it is important to keep in mind that stock and sector analysts are also human and are only offering their opinions to investors.
If you want to keep track of which analysts are outperforming others, you can view updated analyst ratings along withanalyst success scores in Benzinga Pro.
Which Stocks Are Analysts Recommending Now?
Benzinga Edge gives you instant access to all major analyst upgrades, downgrades, and price targets. Sort by accuracy, upside potential, and more. Click here to stay ahead of the market.
This article was generated by Benzinga's automated content engine and reviewed by an editor.
Posted In: RRC


