What 4 Analyst Ratings Have To Say About Flex
Author: Benzinga Insights | October 08, 2025 09:00am
Across the recent three months, 4 analysts have shared their insights on Flex (NASDAQ:FLEX), expressing a variety of opinions spanning from bullish to bearish.
The table below offers a condensed view of their recent ratings, showcasing the changing sentiments over the past 30 days and comparing them to the preceding months.
|
Bullish |
Somewhat Bullish |
Indifferent |
Somewhat Bearish |
Bearish |
| Total Ratings |
2 |
2 |
0 |
0 |
0 |
| Last 30D |
1 |
0 |
0 |
0 |
0 |
| 1M Ago |
0 |
0 |
0 |
0 |
0 |
| 2M Ago |
0 |
0 |
0 |
0 |
0 |
| 3M Ago |
1 |
2 |
0 |
0 |
0 |
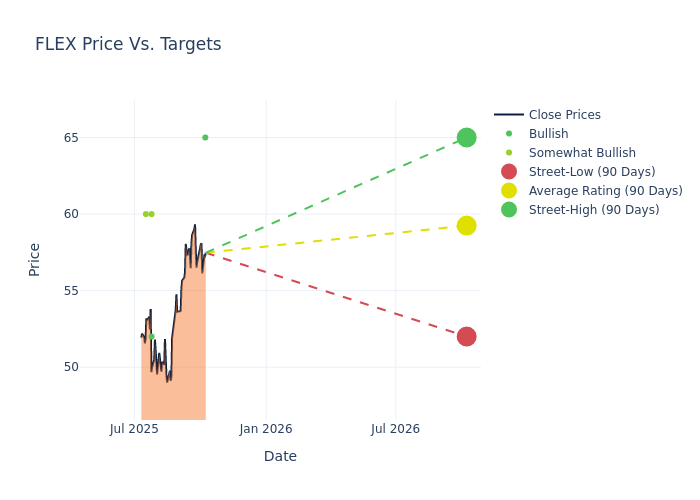
The 12-month price targets, analyzed by analysts, offer insights with an average target of $59.25, a high estimate of $65.00, and a low estimate of $52.00. Observing a 20.3% increase, the current average has risen from the previous average price target of $49.25.
Investigating Analyst Ratings: An Elaborate Study
The standing of Flex among financial experts becomes clear with a thorough analysis of recent analyst actions. The summary below outlines key analysts, their recent evaluations, and adjustments to ratings and price targets.
| Analyst |
Analyst Firm |
Action Taken |
Rating |
Current Price Target |
Prior Price Target |
| Ruplu Bhattacharya |
B of A Securities |
Raises |
Buy |
$65.00 |
$58.00 |
| Ruben Roy |
Stifel |
Raises |
Buy |
$52.00 |
$45.00 |
| George Wang |
Barclays |
Raises |
Overweight |
$60.00 |
$50.00 |
| Samik Chatterjee |
JP Morgan |
Raises |
Overweight |
$60.00 |
$44.00 |
Key Insights:
- Action Taken: Analysts adapt their recommendations to changing market conditions and company performance. Whether they 'Maintain', 'Raise' or 'Lower' their stance, it reflects their response to recent developments related to Flex. This information provides a snapshot of how analysts perceive the current state of the company.
- Rating: Offering a comprehensive view, analysts assess stocks qualitatively, spanning from 'Outperform' to 'Underperform'. These ratings convey expectations for the relative performance of Flex compared to the broader market.
- Price Targets: Analysts set price targets as an estimate of a stock's future value. Comparing the current and prior price targets provides insight into how analysts' expectations have changed over time. This information can be valuable for investors seeking to understand consensus views on the stock's potential future performance.
Navigating through these analyst evaluations alongside other financial indicators can contribute to a holistic understanding of Flex's market standing. Stay informed and make data-driven decisions with our Ratings Table.
Stay up to date on Flex analyst ratings.
Get to Know Flex Better
Flex Ltd is a contract manufacturing company providing comprehensive electronics design, manufacturing, and product management services to electronics and technology companies. The company's operating segments include Flex Agility Solutions (FAS) and Flex Reliability Solutions (FRS). Flex Agility Solutions segment includes markets such as Communications, Enterprise and Cloud; Lifestyle; and Consumer Devices. Flex Reliability Solutions segment includes markets such as Automotive, Health Solutions, and Industrial.
Understanding the Numbers: Flex's Finances
Market Capitalization Analysis: With a profound presence, the company's market capitalization is above industry averages. This reflects substantial size and strong market recognition.
Revenue Growth: Flex's revenue growth over a period of 3M has been noteworthy. As of 30 June, 2025, the company achieved a revenue growth rate of approximately 4.13%. This indicates a substantial increase in the company's top-line earnings. As compared to competitors, the company surpassed expectations with a growth rate higher than the average among peers in the Information Technology sector.
Net Margin: Flex's net margin is impressive, surpassing industry averages. With a net margin of 2.92%, the company demonstrates strong profitability and effective cost management.
Return on Equity (ROE): Flex's ROE surpasses industry standards, highlighting the company's exceptional financial performance. With an impressive 3.81% ROE, the company effectively utilizes shareholder equity capital.
Return on Assets (ROA): The company's ROA is a standout performer, exceeding industry averages. With an impressive ROA of 1.02%, the company showcases effective utilization of assets.
Debt Management: Flex's debt-to-equity ratio surpasses industry norms, standing at 0.84. This suggests the company carries a substantial amount of debt, posing potential financial challenges.
How Are Analyst Ratings Determined?
Experts in banking and financial systems, analysts specialize in reporting for specific stocks or defined sectors. Their comprehensive research involves attending company conference calls and meetings, analyzing financial statements, and engaging with insiders to generate what are known as analyst ratings for stocks. Typically, analysts assess and rate each stock once per quarter.
Some analysts will also offer forecasts for metrics like growth estimates, earnings, and revenue to provide further guidance on stocks. Investors who use analyst ratings should note that this specialized advice comes from humans and may be subject to error.
Breaking: Wall Street's Next Big Mover
Benzinga's #1 analyst just identified a stock poised for explosive growth. This under-the-radar company could surge 200%+ as major market shifts unfold. Click here for urgent details.
This article was generated by Benzinga's automated content engine and reviewed by an editor.
Posted In: FLEX


