Preview: Fastenal's Earnings
Author: Benzinga Insights | October 10, 2025 09:00am
Fastenal (NASDAQ:FAST) is set to give its latest quarterly earnings report on Monday, 2025-10-13. Here's what investors need to know before the announcement.
Analysts estimate that Fastenal will report an earnings per share (EPS) of $0.30.
The announcement from Fastenal is eagerly anticipated, with investors seeking news of surpassing estimates and favorable guidance for the next quarter.
It's worth noting for new investors that guidance can be a key determinant of stock price movements.
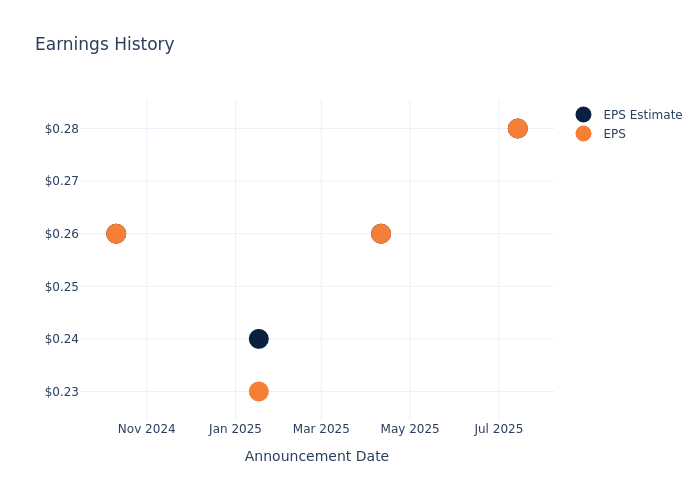
Historical Earnings Performance
During the last quarter, the company reported an EPS missed by $0.00, leading to a 0.13% increase in the share price on the subsequent day.
Here's a look at Fastenal's past performance and the resulting price change:
| Quarter |
Q2 2025 |
Q1 2025 |
Q4 2024 |
Q3 2024 |
| EPS Estimate |
0.28 |
0.26 |
0.24 |
0.26 |
| EPS Actual |
0.28 |
0.26 |
0.23 |
0.26 |
| Price Change % |
0.00% |
6.00% |
2.00% |
10.00% |
Tracking Fastenal's Stock Performance
Shares of Fastenal were trading at $46.71 as of October 09. Over the last 52-week period, shares are up 23.78%. Given that these returns are generally positive, long-term shareholders are likely bullish going into this earnings release.
Analysts' Take on Fastenal
Understanding market sentiments and expectations within the industry is crucial for investors. This analysis delves into the latest insights on Fastenal.
A total of 6 analyst ratings have been received for Fastenal, with the consensus rating being Neutral. The average one-year price target stands at $47.17, suggesting a potential 0.98% upside.
Peer Ratings Comparison
In this comparison, we explore the analyst ratings and average 1-year price targets of Ferguson Enterprises, W.W. Grainger and United Rentals, three prominent industry players, offering insights into their relative performance expectations and market positioning.
- Analysts currently favor an Outperform trajectory for Ferguson Enterprises, with an average 1-year price target of $252.25, suggesting a potential 440.03% upside.
- Analysts currently favor an Neutral trajectory for W.W. Grainger, with an average 1-year price target of $988.75, suggesting a potential 2016.78% upside.
- Analysts currently favor an Outperform trajectory for United Rentals, with an average 1-year price target of $990.92, suggesting a potential 2021.43% upside.
Peer Analysis Summary
The peer analysis summary offers a detailed examination of key metrics for Ferguson Enterprises, W.W. Grainger and United Rentals, providing valuable insights into their respective standings within the industry and their market positions and comparative performance.
| Company |
Consensus |
Revenue Growth |
Gross Profit |
Return on Equity |
| Fastenal |
Neutral |
8.56% |
$942.80M |
8.81% |
| Ferguson Enterprises |
Outperform |
6.93% |
$2.69B |
12.32% |
| W.W. Grainger |
Neutral |
5.61% |
$1.75B |
13.48% |
| United Rentals |
Outperform |
4.51% |
$1.53B |
6.98% |
Key Takeaway:
Fastenal ranks in the middle for Consensus rating. It is at the bottom for Revenue Growth and Gross Profit, but at the top for Return on Equity among its peers.
Get to Know Fastenal Better
Fastenal began as an industrial retailer, expanding its product portfolio from nuts and bolts to cutting tools, safety equipment, and janitorial supplies. It transitioned into a distributor by building out a dense network of branches close to its business customers. Once a customer becomes large enough, Fastenal installs vending machines and its own personnel on-site. Today, these on-site locations exceed Fastenal's branch count and remain the firm's main focus for expansion. Fastenal acts as a one-stop outsourcing partner for its industrial customers, offering value-added services along with a wide breadth of maintenance, repair, and operations supplies.
Key Indicators: Fastenal's Financial Health
Market Capitalization Highlights: Above the industry average, the company's market capitalization signifies a significant scale, indicating strong confidence and market prominence.
Revenue Growth: Fastenal's revenue growth over a period of 3 months has been noteworthy. As of 30 June, 2025, the company achieved a revenue growth rate of approximately 8.56%. This indicates a substantial increase in the company's top-line earnings. As compared to competitors, the company encountered difficulties, with a growth rate lower than the average among peers in the Industrials sector.
Net Margin: Fastenal's net margin excels beyond industry benchmarks, reaching 15.88%. This signifies efficient cost management and strong financial health.
Return on Equity (ROE): The company's ROE is below industry benchmarks, signaling potential difficulties in efficiently using equity capital. With an ROE of 8.81%, the company may need to address challenges in generating satisfactory returns for shareholders.
Return on Assets (ROA): Fastenal's ROA surpasses industry standards, highlighting the company's exceptional financial performance. With an impressive 6.68% ROA, the company effectively utilizes its assets for optimal returns.
Debt Management: With a below-average debt-to-equity ratio of 0.14, Fastenal adopts a prudent financial strategy, indicating a balanced approach to debt management.
To track all earnings releases for Fastenal visit their earnings calendar on our site.
This article was generated by Benzinga's automated content engine and reviewed by an editor.
Posted In: FAST


