Prologis's Earnings: A Preview
Author: Benzinga Insights | October 14, 2025 09:02am
Prologis (NYSE:PLD) will release its quarterly earnings report on Wednesday, 2025-10-15. Here's a brief overview for investors ahead of the announcement.
Analysts anticipate Prologis to report an earnings per share (EPS) of $1.02.
Prologis bulls will hope to hear the company announce they've not only beaten that estimate, but also to provide positive guidance, or forecasted growth, for the next quarter.
New investors should note that it is sometimes not an earnings beat or miss that most affects the price of a stock, but the guidance (or forecast).
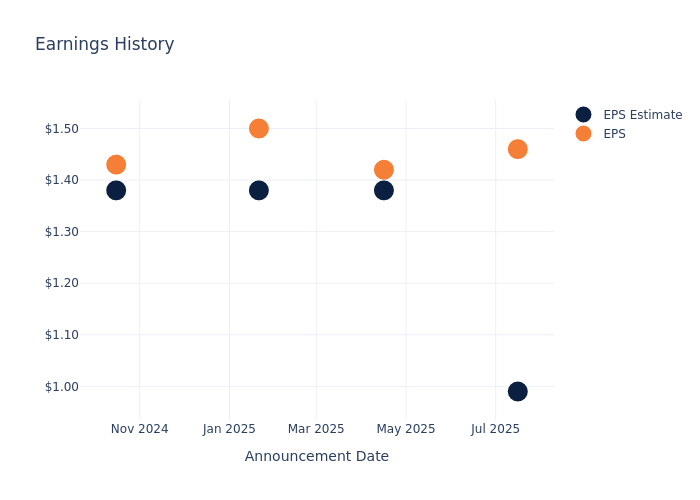
Earnings History Snapshot
The company's EPS beat by $0.47 in the last quarter, leading to a 3.39% drop in the share price on the following day.
Here's a look at Prologis's past performance and the resulting price change:
| Quarter |
Q2 2025 |
Q1 2025 |
Q4 2024 |
Q3 2024 |
| EPS Estimate |
0.99 |
1.38 |
1.38 |
1.38 |
| EPS Actual |
1.46 |
1.42 |
1.50 |
1.43 |
| Price Change % |
-3.00% |
2.00% |
-2.00% |
-3.00% |
Tracking Prologis's Stock Performance
Shares of Prologis were trading at $112.72 as of October 13. Over the last 52-week period, shares are down 11.31%. Given that these returns are generally negative, long-term shareholders are likely upset going into this earnings release.
Analysts' Take on Prologis
Understanding market sentiments and expectations within the industry is crucial for investors. This analysis delves into the latest insights on Prologis.
Analysts have given Prologis a total of 7 ratings, with the consensus rating being Neutral. The average one-year price target is $120.29, indicating a potential 6.72% upside.
Analyzing Analyst Ratings Among Peers
This comparison focuses on the analyst ratings and average 1-year price targets of Rexford Industrial Realty, Lineage and EastGroup Properties, three major players in the industry, shedding light on their relative performance expectations and market positioning.
- Analysts currently favor an Neutral trajectory for Rexford Industrial Realty, with an average 1-year price target of $41.22, suggesting a potential 63.43% downside.
- Analysts currently favor an Neutral trajectory for Lineage, with an average 1-year price target of $47.89, suggesting a potential 57.51% downside.
- Analysts currently favor an Neutral trajectory for EastGroup Properties, with an average 1-year price target of $181.8, suggesting a potential 61.28% upside.
Overview of Peer Analysis
The peer analysis summary offers a detailed examination of key metrics for Rexford Industrial Realty, Lineage and EastGroup Properties, providing valuable insights into their respective standings within the industry and their market positions and comparative performance.
| Company |
Consensus |
Revenue Growth |
Gross Profit |
Return on Equity |
| Prologis |
Neutral |
8.76% |
$1.63B |
1.07% |
| Rexford Industrial Realty |
Neutral |
5.02% |
$194.21M |
1.31% |
| Lineage |
Neutral |
0.90% |
$430M |
-0.07% |
| EastGroup Properties |
Neutral |
11.44% |
$128.92M |
1.88% |
Key Takeaway:
Prologis ranks at the top for Revenue Growth and Gross Profit among its peers. However, it ranks at the bottom for Return on Equity. Overall, Prologis is positioned well compared to its peers in terms of financial performance metrics.
Delving into Prologis's Background
Prologis was formed by the June 2011 merger of AMB Property and Prologis Trust. The company develops, acquires, and operates around 1.3 billion square feet of high-quality industrial and logistics facilities across the globe. The company also has a strategic capital business segment that has around $60 billion of third-party AUM. The company is organized into four global divisions (Americas, Europe, Asia, and other Americas) and operates as a real estate investment trust.
Financial Milestones: Prologis's Journey
Market Capitalization: Positioned above industry average, the company's market capitalization underscores its superiority in size, indicative of a strong market presence.
Positive Revenue Trend: Examining Prologis's financials over 3 months reveals a positive narrative. The company achieved a noteworthy revenue growth rate of 8.76% as of 30 June, 2025, showcasing a substantial increase in top-line earnings. As compared to competitors, the company surpassed expectations with a growth rate higher than the average among peers in the Real Estate sector.
Net Margin: Prologis's net margin surpasses industry standards, highlighting the company's exceptional financial performance. With an impressive 26.09% net margin, the company effectively manages costs and achieves strong profitability.
Return on Equity (ROE): Prologis's financial strength is reflected in its exceptional ROE, which exceeds industry averages. With a remarkable ROE of 1.07%, the company showcases efficient use of equity capital and strong financial health.
Return on Assets (ROA): Prologis's ROA is below industry averages, indicating potential challenges in efficiently utilizing assets. With an ROA of 0.59%, the company may face hurdles in achieving optimal financial returns.
Debt Management: With a below-average debt-to-equity ratio of 0.66, Prologis adopts a prudent financial strategy, indicating a balanced approach to debt management.
To track all earnings releases for Prologis visit their earnings calendar on our site.
This article was generated by Benzinga's automated content engine and reviewed by an editor.
Posted In: PLD


