Insights Ahead: State Street's Quarterly Earnings
Author: Benzinga Insights | October 16, 2025 09:04am
State Street (NYSE:STT) is set to give its latest quarterly earnings report on Friday, 2025-10-17. Here's what investors need to know before the announcement.
Analysts estimate that State Street will report an earnings per share (EPS) of $2.64.
The announcement from State Street is eagerly anticipated, with investors seeking news of surpassing estimates and favorable guidance for the next quarter.
It's worth noting for new investors that guidance can be a key determinant of stock price movements.
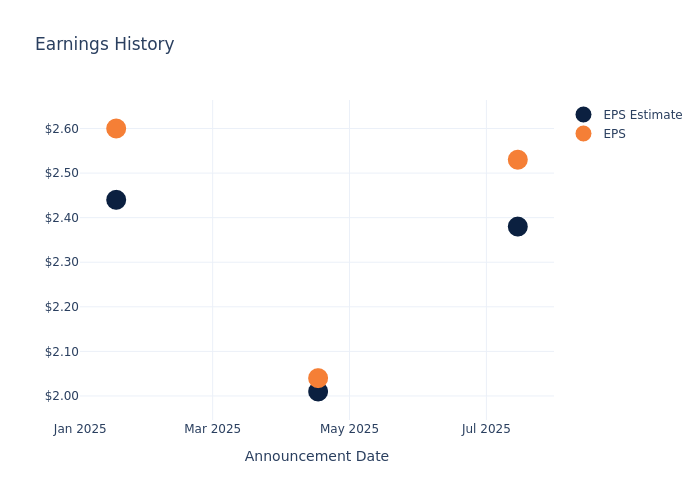
Past Earnings Performance
During the last quarter, the company reported an EPS beat by $0.15, leading to a 2.96% increase in the share price on the subsequent day.
Here's a look at State Street's past performance and the resulting price change:
| Quarter |
Q2 2025 |
Q1 2025 |
Q4 2024 |
Q3 2024 |
| EPS Estimate |
2.38 |
2.01 |
2.44 |
2.12 |
| EPS Actual |
2.53 |
2.04 |
2.60 |
2.26 |
| Price Change % |
3.00 |
2.00 |
-3.00 |
1.00 |
Stock Performance
Shares of State Street were trading at $116.71 as of October 15. Over the last 52-week period, shares are up 26.98%. Given that these returns are generally positive, long-term shareholders are likely bullish going into this earnings release.
Insights Shared by Analysts on State Street
For investors, staying informed about market sentiments and expectations in the industry is paramount. This analysis provides an exploration of the latest insights on State Street.
With 6 analyst ratings, State Street has a consensus rating of Buy. The average one-year price target is $129.33, indicating a potential 10.81% upside.
Comparing Ratings with Competitors
In this analysis, we delve into the analyst ratings and average 1-year price targets of T. Rowe Price Group, Franklin Resources and Invesco, three key industry players, offering insights into their relative performance expectations and market positioning.
- Analysts currently favor an Neutral trajectory for T. Rowe Price Group, with an average 1-year price target of $110.27, suggesting a potential 5.52% downside.
- Analysts currently favor an Underperform trajectory for Franklin Resources, with an average 1-year price target of $24.14, suggesting a potential 79.32% downside.
- Analysts currently favor an Neutral trajectory for Invesco, with an average 1-year price target of $25.12, suggesting a potential 78.48% downside.
Overview of Peer Analysis
In the peer analysis summary, key metrics for T. Rowe Price Group, Franklin Resources and Invesco are highlighted, providing an understanding of their respective standings within the industry and offering insights into their market positions and comparative performance.
| Company |
Consensus |
Revenue Growth |
Gross Profit |
Return on Equity |
| Ares Management |
Outperform |
71.19% |
$706.42M |
3.79% |
| T. Rowe Price Group |
Neutral |
-0.58% |
$828.30M |
4.70% |
| Franklin Resources |
Underperform |
-2.77% |
$1.64B |
0.64% |
| Invesco |
Neutral |
2.17% |
$504.40M |
-0.12% |
Key Takeaway:
State Street ranks at the top for Revenue Growth among its peers. It is in the middle for Gross Profit. For Return on Equity, State Street is at the bottom compared to its peers.
Delving into State Street's Background
State Street is a leading provider of financial services, including investment servicing, investment management, and investment research and trading. With approximately $49 trillion in assets under custody and administration, and $5.1 trillion in assets under management, as of June 30, 2025, State Street operates globally in more than 100 geographic markets and employs about 53,000 worldwide.
State Street: Delving into Financials
Market Capitalization Analysis: The company's market capitalization is above the industry average, indicating that it is relatively larger in size compared to peers. This may suggest a higher level of investor confidence and market recognition.
Revenue Growth: Over the 3 months period, State Street showcased positive performance, achieving a revenue growth rate of 8.71% as of 30 June, 2025. This reflects a substantial increase in the company's top-line earnings. When compared to others in the Financials sector, the company faces challenges, achieving a growth rate lower than the average among peers.
Net Margin: The company's net margin is below industry benchmarks, signaling potential difficulties in achieving strong profitability. With a net margin of 18.16%, the company may need to address challenges in effective cost control.
Return on Equity (ROE): State Street's ROE lags behind industry averages, suggesting challenges in maximizing returns on equity capital. With an ROE of 2.69%, the company may face hurdles in achieving optimal financial performance.
Return on Assets (ROA): The company's ROA is below industry benchmarks, signaling potential difficulties in efficiently utilizing assets. With an ROA of 0.17%, the company may need to address challenges in generating satisfactory returns from its assets.
Debt Management: With a high debt-to-equity ratio of 1.51, State Street faces challenges in effectively managing its debt levels, indicating potential financial strain.
To track all earnings releases for State Street visit their earnings calendar on our site.
This article was generated by Benzinga's automated content engine and reviewed by an editor.
Posted In: STT


