Third Cockroach Appears, But Buying Momentum Persists; Gold May Hit $6K — After A Blowoff Top
Author: The Arora Report | October 17, 2025 11:35am
To gain an edge, this is what you need to know today.
Prudent Investors Pay Attention
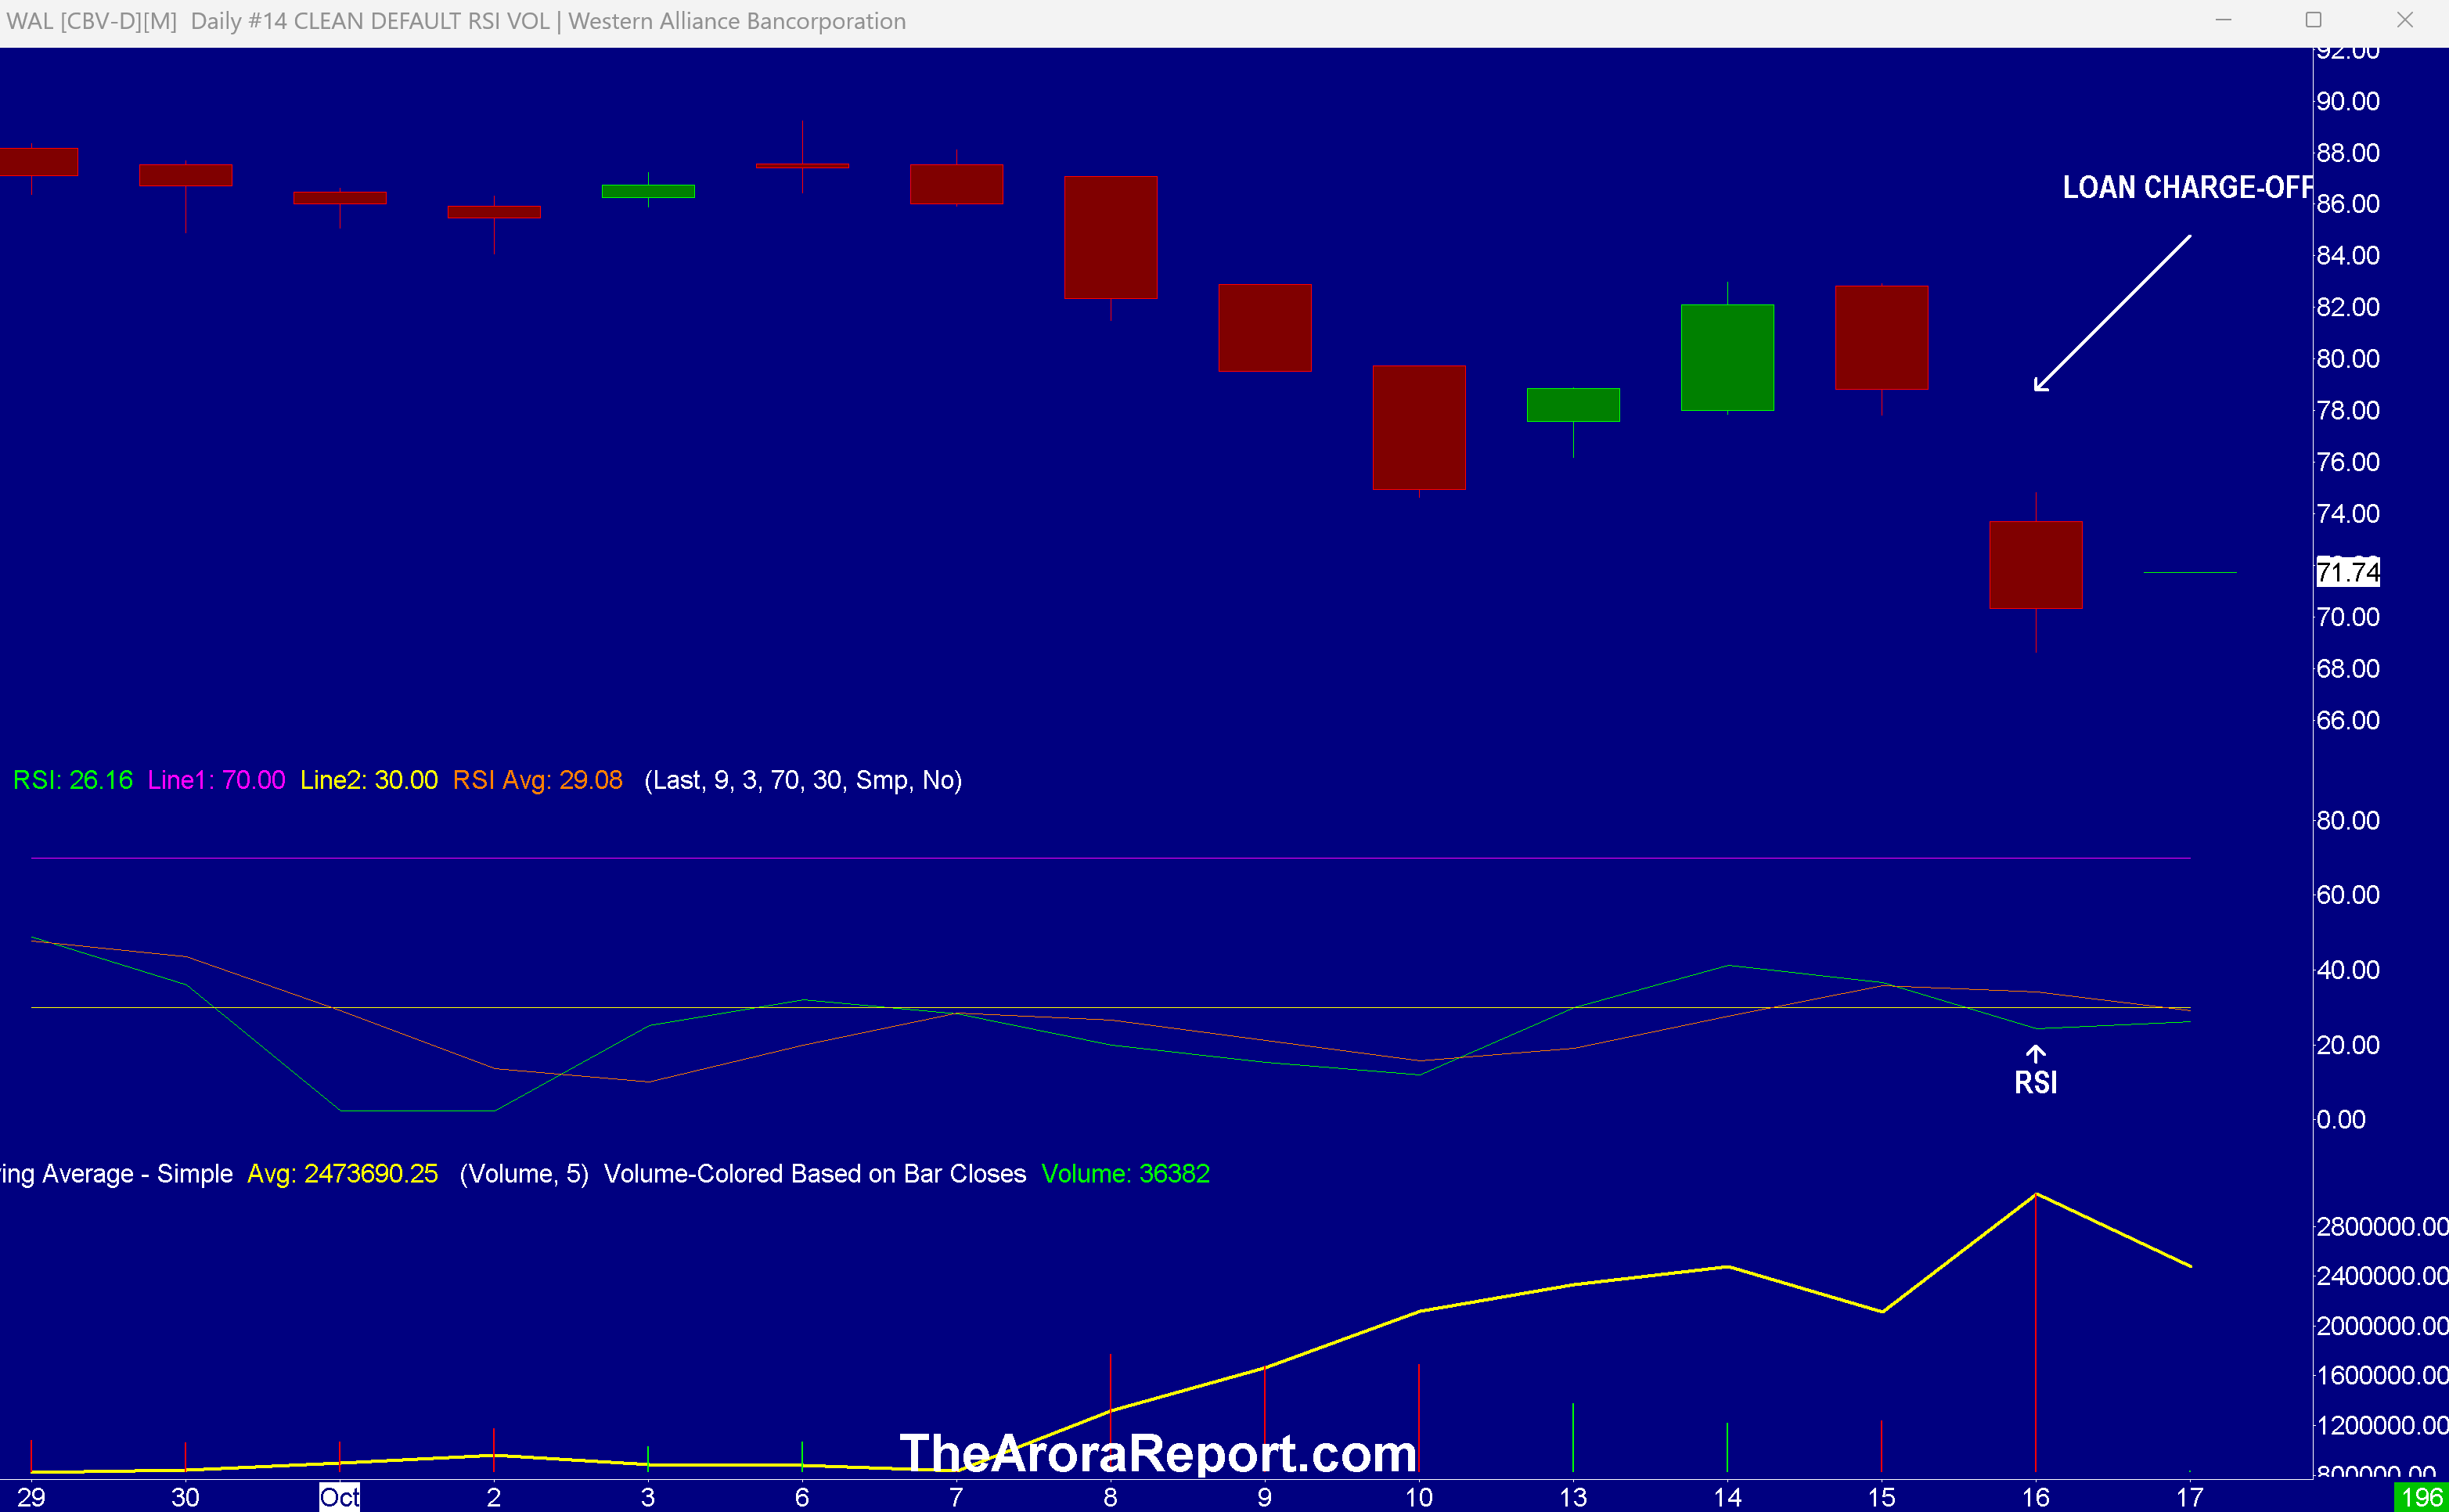
Please click here for an enlarged chart of regional bank Western Alliance Bancorporation (NYSE:WAL).
Note the following:
This article is about the big picture, not an individual stock. The chart of WAL stock is being used to illustrate the point.
The chart shows the gap down on a loan charge-off.
Another regional bank Zions Bancorporation NA (NASDAQ:ZION) also had a charge-off.
The charge-off in both banks is from the same customer linked to distressed commercial mortgages.
Investors may recall the drop in the stock market after the collapse of Silicon Valley Bank in March 2023.
This loan charge-off is akin to the third cockroach that has shown up. The second cockroach was the bankruptcy of auto parts company First Brands. The first cockroach was the bankruptcy of used car deal Tricolor. Please see the Morning Capsule from September 30 for more.
Momo gurus believe these are idiosyncratic issues. You may be wondering how the momo crowd is responding to the drop in WAL and ZION stocks. WAL dipped as low as $68.00, but aggressive momo crowd buying has brought it to $71.75 as of this writing in the premarket. ZION dipped as low as $46.09, but aggressive momo crowd buying has brought it to $48.99 as of this writing in the premarket.
As a prudent investor, you need to decide if there are more cockroaches if three have already appeared. The world's smartest banker Jamie Dimon, CEO of JPMorgan (JPM), said, "…when you see one cockroach, there are probably more… Everyone should be forewarned on this."
In our analysis, right now, many serious problems are lurking under the surface. Prudent investors need to remember what Warren Buffett said, "Only when the tide goes out do you learn who has been swimming naked."
Gold has rocketed as investors rushed to the safety of gold. As is well known, we are long gold from just above $1000. In our analysis, it is not prudent to buy gold here. Last night, there was panic buying in gold, with gold futures reaching $4392. Silver went along for the ride with silver futures reaching as high as $53.76.
For a longer term analysis on gold and silver, please see the gold section below.
Investors are also rushing into U.S. Treasuries. The yield on 10 year U.S. Treasuries fell below 4%. In our analysis, it is also not prudent to rush into long term U.S. Treasuries.
Futures were trading lower in the early trade but then moved up on President Trump's comments about China.
India and Russia
It appears President Trump has spoken to Indian Prime Minister Modi, and Modi has agreed to cut oil purchases from Russia in half.
President Trump sees the best way to put pressure on Russia to stop the Ukraine war is to stop India from buying Russian oil. President Trump is meeting with Ukrainian President Zelenskyy today and will be meeting with Russian President Putin later in Budapest.
What happens in Ukraine has serious implications for oil and the markets.
Magnificent Seven Money Flows
Most portfolios are now heavily concentrated in the Mag 7 stocks. For this reason, to get ahead and get an edge, investors need to to pay attention to early money flows in the Mag 7 stocks on a daily basis.
In the early trade, money flows are neutral in Apple Inc (NASDAQ:AAPL), Amazon.com, Inc. (NASDAQ:AMZN), and Alphabet Inc Class C (NASDAQ:GOOG).
In the early trade, money flows are negative in Meta Platforms Inc (NASDAQ:META), Microsoft Corp (NASDAQ:MSFT), NVIDIA Corp (NASDAQ:NVDA), and Tesla Inc (NASDAQ:TSLA).
In the early trade, money flows are positive in SPDR S&P 500 ETF Trust (NYSE:SPY) and Invesco QQQ Trust Series 1 (NASDAQ:QQQ).
Momo Crowd And Smart Money In Stocks
Investors can gain an edge by knowing money flows in SPY and QQQ. Investors can get a bigger edge by knowing when smart money is buying stocks, gold, and oil. The most popular ETF for gold is SPDR Gold Trust (NYSE:GLD). The most popular ETF for silver is iShares Silver Trust (NYSE:SLV). The most popular ETF for oil is United States Oil ETF (ASCA:USO).
Gold
The primary narrative that is driving gold and silver higher is dollar debasement. Based on our algorithms, there is a 65% probability that this narrative will continue to the end of 2026 and beyond, but it is not possible at this time to confidently predict the intensity of this narrative. Having said that, if the dollar debasement narrative becomes intense, gold can hit $6000, and silver can reach $75 in the long term. On the other hand, both gold and silver are technically very overbought. As a result, a sharp pullback can occur anytime. A sharp pullback can bring gold to $3500 and silver to $40. An even sharper correction can occur if inflation heats up and the Fed is unable to lower interest rates as anticipated.
In the near term, gold is showing all of the signs that typically precede a blowoff top. At this time, the probability of a blowoff top occurring in gold and silver is 90%. Remember, this is only near term. The plan is to buy more gold, silver, and miners on any substantial dip.
Consider continuing to hold good, very long term, existing positions. Based on individual risk preference, consider a protection band consisting of cash or Treasury bills or short-term tactical trades as well as short to medium term hedges and short term hedges. This is a good way to protect yourself and participate in the upside at the same time.
You can determine your protection bands by adding cash to hedges. The high band of the protection is appropriate for those who are older or conservative. The low band of the protection is appropriate for those who are younger or aggressive. If you do not hedge, the total cash level should be more than stated above but significantly less than cash plus hedges.
A protection band of 0% would be very bullish and would indicate full investment with 0% in cash. A protection band of 100% would be very bearish and would indicate a need for aggressive protection with cash and hedges or aggressive short selling.
It is worth reminding that you cannot take advantage of new upcoming opportunities if you are not holding enough cash. When adjusting hedge levels, consider adjusting partial stop quantities for stock positions (non ETF); consider using wider stops on remaining quantities and also allowing more room for high beta stocks. High beta stocks are the ones that move more than the market.
Traditional 60/40 Portfolio
Probability based risk reward adjusted for inflation does not favor long duration strategic bond allocation at this time.
Those who want to stick to traditional 60% allocation to stocks and 40% to bonds may consider focusing on only high quality bonds and bonds of five year duration or less. Those willing to bring sophistication to their investing may consider using bond ETFs as tactical positions and not strategic positions at this time.
**
The Arora Report is known for its accurate calls. The Arora Report correctly called the big artificial intelligence rally before anyone else, the new bull market of 2023, the bear market of 2022, new stock market highs right after the virus low in 2020, the virus drop in 2020, the DJIA rally to 30,000 when it was trading at 16,000, the start of a mega bull market in 2009, and the financial crash of 2008. Please click here to sign up for a free forever Generate Wealth Newsletter.
**
Benzinga Disclaimer: This article is from an unpaid external contributor. It does not represent Benzinga’s reporting and has not been edited for content or accuracy.