Smart Money Sells Quantum, Nuclear And Space Stocks; Earnings, Inflation Data Awaited
Author: The Arora Report | October 21, 2025 11:38am
Smart Money Selling Momo Crowd Favorites
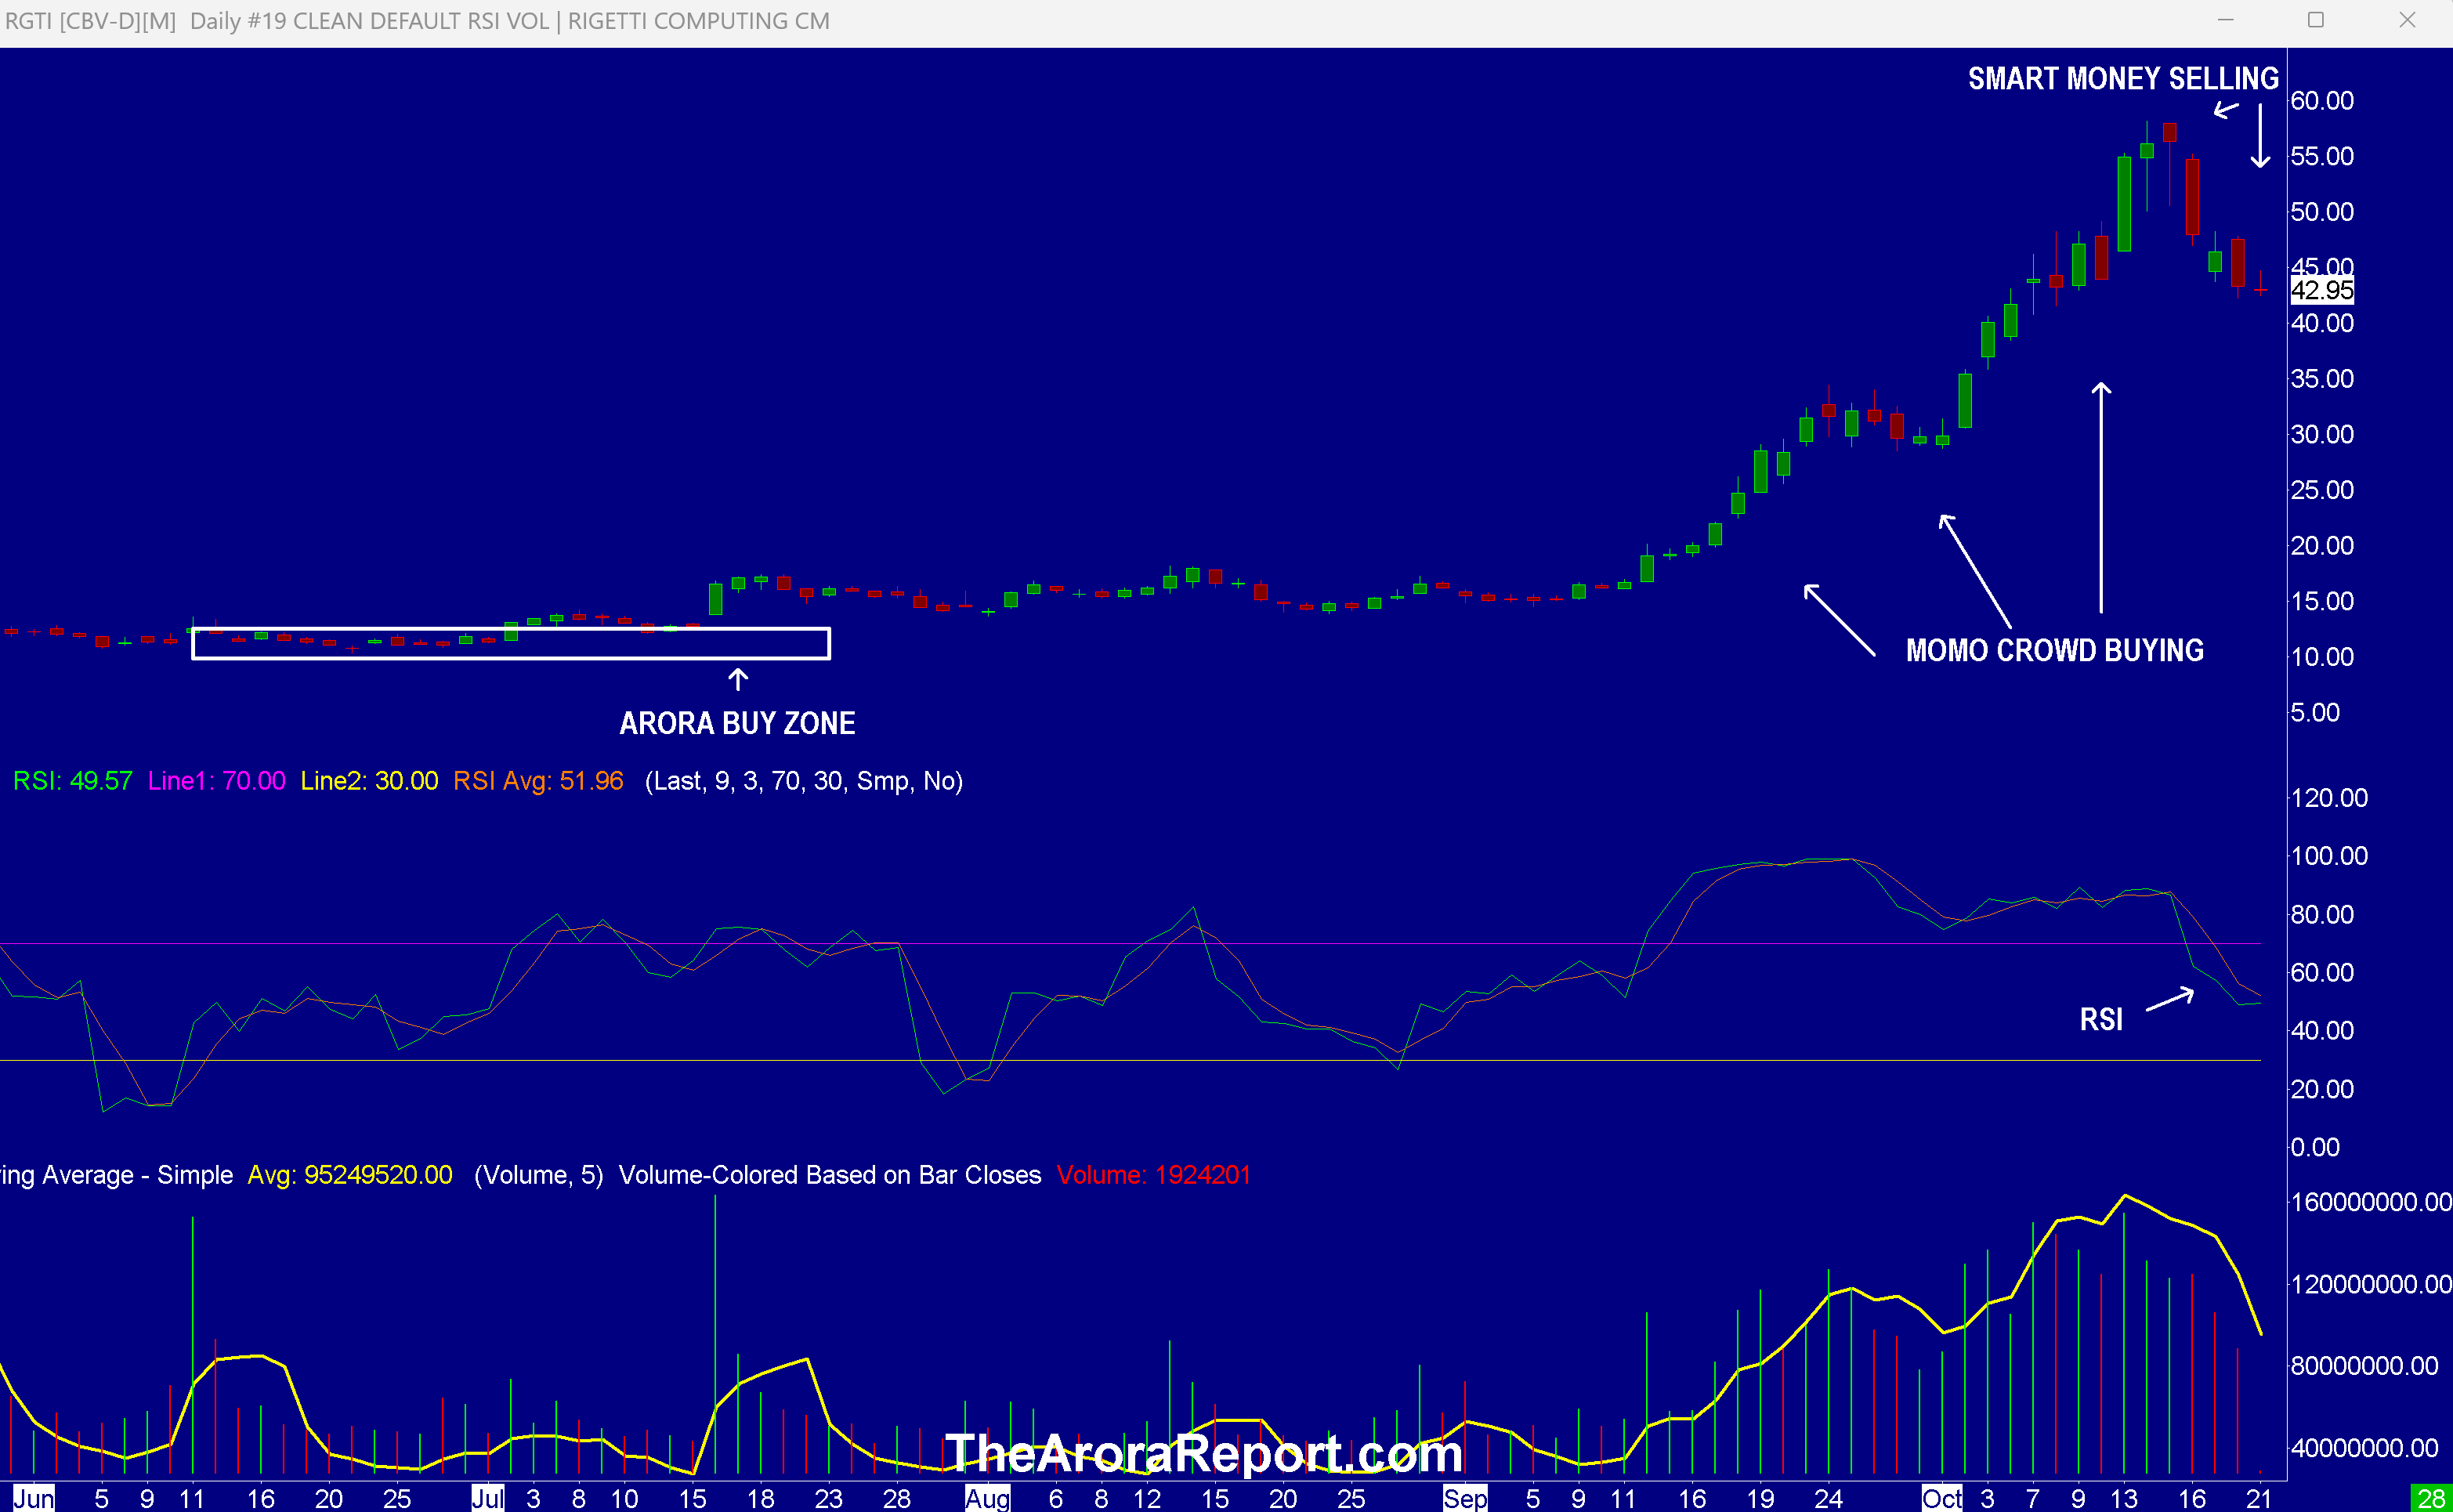
Please click here for an enlarged chart of Rigetti Computing Inc (NASDAQ:RGTI).
Note the following:
This article is about the big picture, not an individual stock. The chart of RGTI stock is being used to illustrate the point.
The chart shows our buy zone for quantum computing stock RGTI.
The chart shows relentless buying by the momo crowd.
The chart shows smart money is beginning to sell RGTI stock.
It is not just RGTI. The momo crowd has been relentlessly buying other quantum computing stocks such as IONQ Inc (NYSE:IONQ), and D-Wave Quantum Inc (NYSE:QBTS), and Quantum Computing Inc (NASDAQ:QUBT), nuclear stocks such as Oklo Inc (NYSE:OKLO) and Nano Nuclear Energy Inc (NASDAQ:NNE), and space stocks such as AST SpaceMobile Inc (NASDAQ:ASTS). Selling is also being seen in the momo crowd's favorite data center stocks such as CoreWeave Inc (NASDAQ:CRWV), Nebius Group NV (NASDAQ:NBIS), and IREN Ltd (NASDAQ:IREN). Smart money selling is being seen in all of the speculative stocks as well as other stocks that are favorites of the momo crowd.
In our analysis, there is significant potential in quantum computing, space, and nuclear stocks. It is just that in the near term the momo crowd has taken these stocks far beyond what they are worth. These stocks are the poster children of several excesses that have happened in this bull market.
Yesterday saw aggressive buying in rare earth mineral stocks as President Trump struck a deal with Australia on rare earth minerals. Rare earth mineral stocks in Australia soared. Two Australian rare earth mineral stocks that trade in the U.S. are Lynas Rare Earths Ltd (OTC:LYSCF) and American Rare Earths Ltd (OTC:ARRNF). This morning, the U.S. based rare earth mineral stocks such as MP Materials Corp (NYSE:MP), USA Rare Earth Inc (NASDAQ:USAR), and Critical Metals Corp (NASDAQ:CRML) are seeing selling on the prospect of competition from Australia.
About 20% of S&P 500 companies report earnings this week. This morning started out with very strong earnings from General Motors Co (NYSE:GM).
Investors are eagerly awaiting inflation data which will be released on October 24.
Japan
Money is flowing into Japanese stocks as Japan tilts to the right and Sanae Takaichi becomes the first female prime minister.
Magnificent Seven Money Flows
Most portfolios are now heavily concentrated in the Mag 7 stocks. For this reason, to get ahead and get an edge, pay attention to early money flows in the Mag 7 stocks on a daily basis.
In the early trade, money flows are positive in Amazon.com, Inc. (NASDAQ:AMZN), Meta Platforms Inc (NASDAQ:META), and NVIDIA Corp (NASDAQ:NVDA).
In the early trade, money flows are neutral in Microsoft Corp (NASDAQ:MSFT).
In the early trade, money flows are negative in Apple Inc (NASDAQ:AAPL), Alphabet Inc Class C (NASDAQ:GOOG), and Tesla Inc (NASDAQ:TSLA).
In the early trade, money flows are neutral in SPDR S&P 500 ETF Trust (NYSE:SPY) and Invesco QQQ Trust Series 1 (NASDAQ:QQQ).
Momo Crowd And Smart Money In Stocks
Investors can gain an edge by knowing money flows in SPY and QQQ. Investors can get a bigger edge by knowing when smart money is buying stocks, gold, and oil. The most popular ETF for gold is SPDR Gold Trust (GLD). The most popular ETF for silver is iShares Silver Trust (SLV). The most popular ETF for oil is United States Oil ETF (NYSE:USO).
Oil
Oil is seeing buying on the prospect of peace between Russia and Ukraine.
Consider continuing to hold good, very long term, existing positions. Based on individual risk preference, consider a protection band consisting of cash or Treasury bills or short-term tactical trades as well as short to medium term hedges and short term hedges. This is a good way to protect yourself and participate in the upside at the same time.
You can determine your protection bands by adding cash to hedges. The high band of the protection is appropriate for those who are older or conservative. The low band of the protection is appropriate for those who are younger or aggressive. If you do not hedge, the total cash level should be more than stated above but significantly less than cash plus hedges.
A protection band of 0% would be very bullish and would indicate full investment with 0% in cash. A protection band of 100% would be very bearish and would indicate a need for aggressive protection with cash and hedges or aggressive short selling.
It is worth reminding that you cannot take advantage of new upcoming opportunities if you are not holding enough cash. When adjusting hedge levels, consider adjusting partial stop quantities for stock positions (non ETF); consider using wider stops on remaining quantities and also allowing more room for high beta stocks. High beta stocks are the ones that move more than the market.
Traditional 60/40 Portfolio
Probability based risk reward adjusted for inflation does not favor long duration strategic bond allocation at this time.
Those who want to stick to traditional 60% allocation to stocks and 40% to bonds may consider focusing on only high quality bonds and bonds of five year duration or less. Those willing to bring sophistication to their investing may consider using bond ETFs as tactical positions and not strategic positions at this time.
The Arora Report is known for its accurate calls. The Arora Report correctly called the big artificial intelligence rally before anyone else, the new bull market of 2023, the bear market of 2022, new stock market highs right after the virus low in 2020, the virus drop in 2020, the DJIA rally to 30,000 when it was trading at 16,000, the start of a mega bull market in 2009, and the financial crash of 2008. Please click here to sign up for a free forever Generate Wealth Newsletter.
Benzinga Disclaimer: This article is from an unpaid external contributor. It does not represent Benzinga’s reporting and has not been edited for content or accuracy.