Insights into Knight-Swift's Upcoming Earnings
Author: Benzinga Insights | October 21, 2025 01:03pm
Knight-Swift (NYSE:KNX) will release its quarterly earnings report on Wednesday, 2025-10-22. Here's a brief overview for investors ahead of the announcement.
Analysts anticipate Knight-Swift to report an earnings per share (EPS) of $0.37.
Anticipation surrounds Knight-Swift's announcement, with investors hoping to hear about both surpassing estimates and receiving positive guidance for the next quarter.
New investors should understand that while earnings performance is important, market reactions are often driven by guidance.
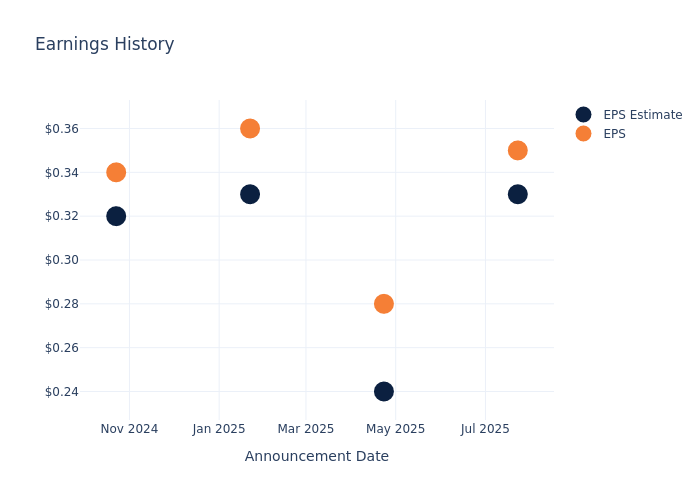
Earnings History Snapshot
The company's EPS beat by $0.02 in the last quarter, leading to a 0.24% drop in the share price on the following day.
Here's a look at Knight-Swift's past performance and the resulting price change:
| Quarter |
Q2 2025 |
Q1 2025 |
Q4 2024 |
Q3 2024 |
| EPS Estimate |
0.33 |
0.24 |
0.33 |
0.32 |
| EPS Actual |
0.35 |
0.28 |
0.36 |
0.34 |
| Price Change % |
0.00 |
2.00 |
5.00 |
-2.00 |
Tracking Knight-Swift's Stock Performance
Shares of Knight-Swift were trading at $47.57 as of October 20. Over the last 52-week period, shares are down 9.1%. Given that these returns are generally negative, long-term shareholders are likely a little upset going into this earnings release.
Analyst Views on Knight-Swift
For investors, grasping market sentiments and expectations in the industry is vital. This analysis explores the latest insights regarding Knight-Swift.
Analysts have provided Knight-Swift with 16 ratings, resulting in a consensus rating of Neutral. The average one-year price target stands at $50.69, suggesting a potential 6.56% upside.
Peer Ratings Comparison
The following analysis focuses on the analyst ratings and average 1-year price targets of TFI International, Ryder System and Saia, three prominent industry players, providing insights into their relative performance expectations and market positioning.
- Analysts currently favor an Neutral trajectory for TFI International, with an average 1-year price target of $108.38, suggesting a potential 127.83% upside.
- Analysts currently favor an Outperform trajectory for Ryder System, with an average 1-year price target of $201.8, suggesting a potential 324.22% upside.
- Analysts currently favor an Outperform trajectory for Saia, with an average 1-year price target of $352.78, suggesting a potential 641.6% upside.
Insights: Peer Analysis
The peer analysis summary provides a snapshot of key metrics for TFI International, Ryder System and Saia, illuminating their respective standings within the industry. These metrics offer valuable insights into their market positions and comparative performance.
| Company |
Consensus |
Revenue Growth |
Gross Profit |
Return on Equity |
| Knight-Swift |
Neutral |
0.83% |
$259.12M |
0.48% |
| TFI International |
Neutral |
-10.02% |
$265.95M |
3.70% |
| Ryder System |
Outperform |
-0.44% |
$660M |
4.31% |
| Saia |
Outperform |
-0.74% |
$144.26M |
2.98% |
Key Takeaway:
Knight-Swift ranks at the top for Gross Profit and Return on Equity among its peers. It is in the middle for Revenue Growth.
Discovering Knight-Swift: A Closer Look
Knight-Swift is the largest full-truckload carrier in the US, with a diversified transportation offering. Pro forma for the US Xpress deal, about 82% of revenue derives from Knight's asset-based trucking business, with full truckload (for-hire dry van, refrigerated, and dedicated contract) making up 69% and less than truckload 13%. Truck brokerage and other asset-light logistics services make up 9% of revenue, with intermodal near 6%. Knight's intermodal operations use the Class I railroads for the underlying movement of its shipping containers and include drayage (regional trucking services to and from inland intermodal ramps/terminals). The remainder of revenue reflects services offered to shippers and third-party truckers, including equipment maintenance and leasing.
Knight-Swift's Economic Impact: An Analysis
Market Capitalization Analysis: The company's market capitalization surpasses industry averages, showcasing a dominant size relative to peers and suggesting a strong market position.
Revenue Growth: Knight-Swift's remarkable performance in 3 months is evident. As of 30 June, 2025, the company achieved an impressive revenue growth rate of 0.83%. This signifies a substantial increase in the company's top-line earnings. As compared to competitors, the company encountered difficulties, with a growth rate lower than the average among peers in the Industrials sector.
Net Margin: Knight-Swift's net margin excels beyond industry benchmarks, reaching 1.84%. This signifies efficient cost management and strong financial health.
Return on Equity (ROE): The company's ROE is a standout performer, exceeding industry averages. With an impressive ROE of 0.48%, the company showcases effective utilization of equity capital.
Return on Assets (ROA): Knight-Swift's ROA stands out, surpassing industry averages. With an impressive ROA of 0.27%, the company demonstrates effective utilization of assets and strong financial performance.
Debt Management: Knight-Swift's debt-to-equity ratio is below the industry average at 0.44, reflecting a lower dependency on debt financing and a more conservative financial approach.
To track all earnings releases for Knight-Swift visit their earnings calendar on our site.
This article was generated by Benzinga's automated content engine and reviewed by an editor.
Posted In: KNX


