A Glimpse Into The Expert Outlook On 3M Through 7 Analysts
Author: Benzinga Insights | October 22, 2025 01:01pm
7 analysts have shared their evaluations of 3M (NYSE:MMM) during the recent three months, expressing a mix of bullish and bearish perspectives.
Summarizing their recent assessments, the table below illustrates the evolving sentiments in the past 30 days and compares them to the preceding months.
|
Bullish |
Somewhat Bullish |
Indifferent |
Somewhat Bearish |
Bearish |
| Total Ratings |
0 |
4 |
2 |
1 |
0 |
| Last 30D |
0 |
2 |
1 |
1 |
0 |
| 1M Ago |
0 |
2 |
1 |
0 |
0 |
| 2M Ago |
0 |
0 |
0 |
0 |
0 |
| 3M Ago |
0 |
0 |
0 |
0 |
0 |
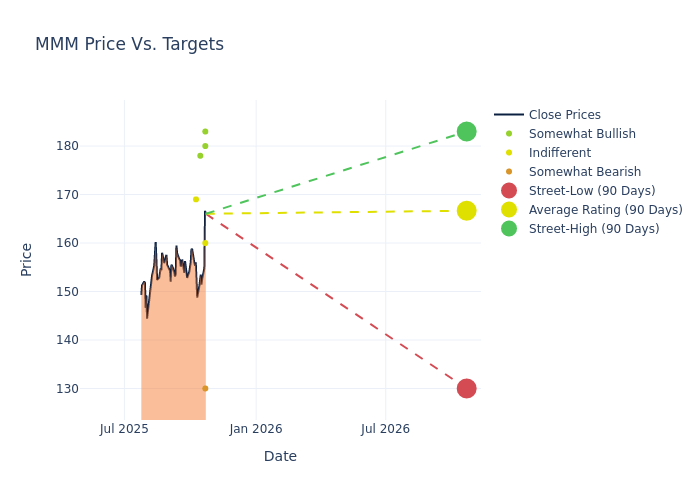
The 12-month price targets assessed by analysts reveal further insights, featuring an average target of $168.0, a high estimate of $183.00, and a low estimate of $130.00. Witnessing a positive shift, the current average has risen by 6.62% from the previous average price target of $157.57.
Deciphering Analyst Ratings: An In-Depth Analysis
In examining recent analyst actions, we gain insights into how financial experts perceive 3M. The following summary outlines key analysts, their recent evaluations, and adjustments to ratings and price targets.
| Analyst |
Analyst Firm |
Action Taken |
Rating |
Current Price Target |
Prior Price Target |
| Chris Snyder |
Morgan Stanley |
Raises |
Equal-Weight |
$160.00 |
$130.00 |
| Julian Mitchell |
Barclays |
Raises |
Overweight |
$180.00 |
$172.00 |
| Deane Dray |
RBC Capital |
Raises |
Underperform |
$130.00 |
$120.00 |
| Joe O'Dea |
Wells Fargo |
Raises |
Overweight |
$183.00 |
$176.00 |
| Stephen Tusa |
JP Morgan |
Raises |
Overweight |
$178.00 |
$175.00 |
| Andrew Kaplowitz |
Citigroup |
Raises |
Neutral |
$169.00 |
$160.00 |
| Joe O'Dea |
Wells Fargo |
Raises |
Overweight |
$176.00 |
$170.00 |
Key Insights:
- Action Taken: Analysts adapt their recommendations to changing market conditions and company performance. Whether they 'Maintain', 'Raise' or 'Lower' their stance, it reflects their response to recent developments related to 3M. This information provides a snapshot of how analysts perceive the current state of the company.
- Rating: Analyzing trends, analysts offer qualitative evaluations, ranging from 'Outperform' to 'Underperform'. These ratings convey expectations for the relative performance of 3M compared to the broader market.
- Price Targets: Analysts predict movements in price targets, offering estimates for 3M's future value. Examining the current and prior targets offers insights into analysts' evolving expectations.
To gain a panoramic view of 3M's market performance, explore these analyst evaluations alongside essential financial indicators. Stay informed and make judicious decisions using our Ratings Table.
Stay up to date on 3M analyst ratings.
Get to Know 3M Better
3M, a multinational conglomerate founded in 1902, sells tens of thousands of products ranging from sponges to respirators. The firm is well known for its extensive research and development capabilities, and it is a pioneer in inventing new use cases for its proprietary technologies. 3M is organized across three business segments: safety and industrial (representing around 44% of revenue), transportation and electronics (36%), and consumer (20%). The firm recently spun off its healthcare business, now known as Solventum. Nearly half of 3M's revenue comes from outside the Americas.
3M's Economic Impact: An Analysis
Market Capitalization: Exceeding industry standards, the company's market capitalization places it above industry average in size relative to peers. This emphasizes its significant scale and robust market position.
Revenue Growth: 3M's revenue growth over a period of 3M has been noteworthy. As of 30 June, 2025, the company achieved a revenue growth rate of approximately 1.42%. This indicates a substantial increase in the company's top-line earnings. As compared to its peers, the company achieved a growth rate higher than the average among peers in Industrials sector.
Net Margin: 3M's financial strength is reflected in its exceptional net margin, which exceeds industry averages. With a remarkable net margin of 11.4%, the company showcases strong profitability and effective cost management.
Return on Equity (ROE): The company's ROE is a standout performer, exceeding industry averages. With an impressive ROE of 16.52%, the company showcases effective utilization of equity capital.
Return on Assets (ROA): 3M's ROA stands out, surpassing industry averages. With an impressive ROA of 1.86%, the company demonstrates effective utilization of assets and strong financial performance.
Debt Management: With a below-average debt-to-equity ratio of 3.2, 3M adopts a prudent financial strategy, indicating a balanced approach to debt management.
How Are Analyst Ratings Determined?
Ratings come from analysts, or specialists within banking and financial systems that report for specific stocks or defined sectors (typically once per quarter for each stock). Analysts usually derive their information from company conference calls and meetings, financial statements, and conversations with important insiders to reach their decisions.
Some analysts publish their predictions for metrics such as growth estimates, earnings, and revenue to provide additional guidance with their ratings. When using analyst ratings, it is important to keep in mind that stock and sector analysts are also human and are only offering their opinions to investors.
If you want to keep track of which analysts are outperforming others, you can view updated analyst ratings along withanalyst success scores in Benzinga Pro.
Breaking: Wall Street's Next Big Mover
Benzinga's #1 analyst just identified a stock poised for explosive growth. This under-the-radar company could surge 200%+ as major market shifts unfold. Click here for urgent details.
This article was generated by Benzinga's automated content engine and reviewed by an editor.
Posted In: MMM


