Earnings Preview For Dorman Prods
Author: Benzinga Insights | October 24, 2025 11:01am
Dorman Prods (NASDAQ:DORM) will release its quarterly earnings report on Monday, 2025-10-27. Here's a brief overview for investors ahead of the announcement.
Analysts anticipate Dorman Prods to report an earnings per share (EPS) of $2.42.
Anticipation surrounds Dorman Prods's announcement, with investors hoping to hear about both surpassing estimates and receiving positive guidance for the next quarter.
New investors should understand that while earnings performance is important, market reactions are often driven by guidance.
Historical Earnings Performance
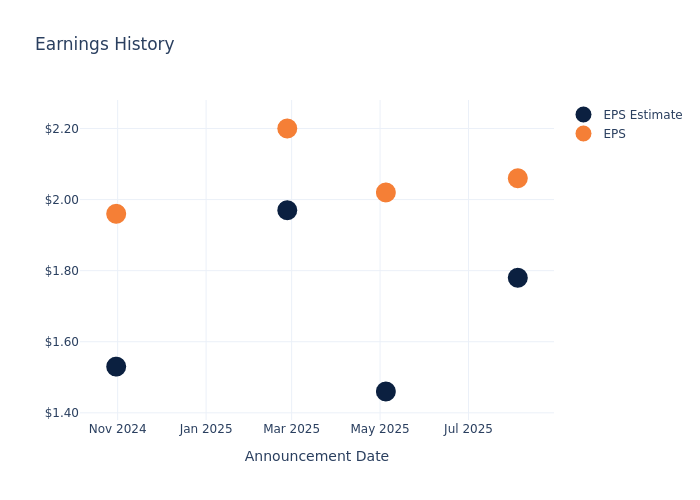
During the last quarter, the company reported an EPS beat by $0.28, leading to a 6.87% increase in the share price on the subsequent day.
Here's a look at Dorman Prods's past performance and the resulting price change:
| Quarter |
Q2 2025 |
Q1 2025 |
Q4 2024 |
Q3 2024 |
| EPS Estimate |
1.78 |
1.46 |
1.97 |
1.53 |
| EPS Actual |
2.06 |
2.02 |
2.20 |
1.96 |
| Price Change % |
7.00 |
7.00 |
3.00 |
12.00 |
Dorman Prods Share Price Analysis
Shares of Dorman Prods were trading at $155.25 as of October 23. Over the last 52-week period, shares are up 35.9%. Given that these returns are generally positive, long-term shareholders should be satisfied going into this earnings release.
Analyst Views on Dorman Prods
For investors, staying informed about market sentiments and expectations in the industry is paramount. This analysis provides an exploration of the latest insights on Dorman Prods.
Analysts have given Dorman Prods a total of 4 ratings, with the consensus rating being Outperform. The average one-year price target is $180.5, indicating a potential 16.26% upside.
Peer Ratings Overview
The analysis below examines the analyst ratings and average 1-year price targets of Lear, Gentex and Patrick Industries, three significant industry players, providing valuable insights into their relative performance expectations and market positioning.
- Analysts currently favor an Neutral trajectory for Lear, with an average 1-year price target of $114.71, suggesting a potential 26.11% downside.
- Analysts currently favor an Neutral trajectory for Gentex, with an average 1-year price target of $30.2, suggesting a potential 80.55% downside.
- Analysts currently favor an Outperform trajectory for Patrick Industries, with an average 1-year price target of $110.6, suggesting a potential 28.76% downside.
Peers Comparative Analysis Summary
In the peer analysis summary, key metrics for Lear, Gentex and Patrick Industries are highlighted, providing an understanding of their respective standings within the industry and offering insights into their market positions and comparative performance.
| Company |
Consensus |
Revenue Growth |
Gross Profit |
Return on Equity |
| Dorman Products |
Outperform |
7.56% |
$219.51M |
4.29% |
| Lear |
Neutral |
-47.97% |
$439.10M |
3.39% |
| Gentex |
Neutral |
14.82% |
$225.29M |
3.86% |
| Patrick Industries |
Outperform |
3.04% |
$250.63M |
2.84% |
Key Takeaway:
Dorman Prods ranks highest in Revenue Growth among its peers. It also leads in Gross Profit. However, it ranks second in Consensus rating and third in Return on Equity.
Unveiling the Story Behind Dorman Prods
Dorman Products Inc is a supplier of original equipment parts for automobiles. It offers automotive and heavy-duty replacement parts, automotive hardware, brake parts, and fasteners for the automotive and heavy-duty aftermarket. The products are sold under the Dorman brand and its sub-brands OE Solutions, Help!, Conduct-Tite, Super ATV, etc., through aftermarket retailers, warehouse distributors, specialty markets, and salvage yards. The company operates through three business segments, which include Light Duty, Heavy Duty, and Specialty Vehicle. A majority of its revenue is generated from the Light Duty segment, which designs and markets replacement parts and fasteners mainly for passenger cars and light trucks. Geographically, it derives key revenue from the United States.
Dorman Prods's Financial Performance
Market Capitalization Analysis: Reflecting a smaller scale, the company's market capitalization is positioned below industry averages. This could be attributed to factors such as growth expectations or operational capacity.
Revenue Growth: Dorman Prods displayed positive results in 3 months. As of 30 June, 2025, the company achieved a solid revenue growth rate of approximately 7.56%. This indicates a notable increase in the company's top-line earnings. As compared to competitors, the company surpassed expectations with a growth rate higher than the average among peers in the Consumer Discretionary sector.
Net Margin: Dorman Prods's net margin surpasses industry standards, highlighting the company's exceptional financial performance. With an impressive 10.85% net margin, the company effectively manages costs and achieves strong profitability.
Return on Equity (ROE): Dorman Prods's ROE stands out, surpassing industry averages. With an impressive ROE of 4.29%, the company demonstrates effective use of equity capital and strong financial performance.
Return on Assets (ROA): Dorman Prods's ROA stands out, surpassing industry averages. With an impressive ROA of 2.4%, the company demonstrates effective utilization of assets and strong financial performance.
Debt Management: Dorman Prods's debt-to-equity ratio is below the industry average at 0.4, reflecting a lower dependency on debt financing and a more conservative financial approach.
To track all earnings releases for Dorman Prods visit their earnings calendar on our site.
This article was generated by Benzinga's automated content engine and reviewed by an editor.
Posted In: DORM


