GeneDx Hldgs's Earnings: A Preview
Author: Benzinga Insights | October 27, 2025 01:01pm
GeneDx Hldgs (NASDAQ:WGS) is preparing to release its quarterly earnings on Tuesday, 2025-10-28. Here's a brief overview of what investors should keep in mind before the announcement.
Analysts expect GeneDx Hldgs to report an earnings per share (EPS) of $0.37.
Anticipation surrounds GeneDx Hldgs's announcement, with investors hoping to hear about both surpassing estimates and receiving positive guidance for the next quarter.
New investors should understand that while earnings performance is important, market reactions are often driven by guidance.
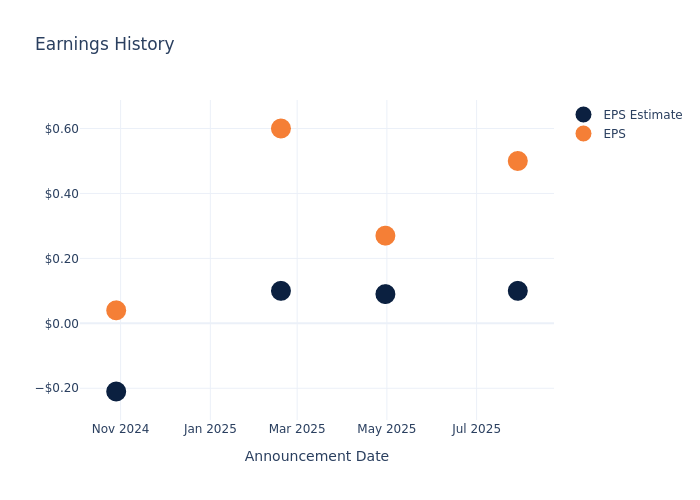
Earnings History Snapshot
Last quarter the company beat EPS by $0.40, which was followed by a 12.78% increase in the share price the next day.
Here's a look at GeneDx Hldgs's past performance and the resulting price change:
| Quarter |
Q2 2025 |
Q1 2025 |
Q4 2024 |
Q3 2024 |
| EPS Estimate |
0.1 |
0.09 |
0.1 |
-0.21 |
| EPS Actual |
0.5 |
0.27 |
0.6 |
0.04 |
| Price Change % |
13.0 |
-7.00 |
-1.0 |
-1.00 |
Performance of GeneDx Hldgs Shares
Shares of GeneDx Hldgs were trading at $128.87 as of October 24. Over the last 52-week period, shares are up 57.11%. Given that these returns are generally positive, long-term shareholders are likely bullish going into this earnings release.
Analysts' Perspectives on GeneDx Hldgs
For investors, grasping market sentiments and expectations in the industry is vital. This analysis explores the latest insights regarding GeneDx Hldgs.
Analysts have given GeneDx Hldgs a total of 5 ratings, with the consensus rating being Buy. The average one-year price target is $130.0, indicating a potential 0.88% upside.
Peer Ratings Overview
The analysis below examines the analyst ratings and average 1-year price targets of Privia Health Gr, Option Care Health and Premier, three significant industry players, providing valuable insights into their relative performance expectations and market positioning.
- Analysts currently favor an Outperform trajectory for Privia Health Gr, with an average 1-year price target of $30.2, suggesting a potential 76.57% downside.
- Analysts currently favor an Outperform trajectory for Option Care Health, with an average 1-year price target of $35.25, suggesting a potential 72.65% downside.
- Analysts currently favor an Neutral trajectory for Premier, with an average 1-year price target of $26.19, suggesting a potential 79.68% downside.
Peer Analysis Summary
The peer analysis summary outlines pivotal metrics for Privia Health Gr, Option Care Health and Premier, demonstrating their respective standings within the industry and offering valuable insights into their market positions and comparative performance.
| Company |
Consensus |
Revenue Growth |
Gross Profit |
Return on Equity |
| GeneDx Holdings |
Buy |
45.63% |
$70.90M |
4.04% |
| Privia Health Gr |
Outperform |
23.40% |
$50.24M |
0.40% |
| Option Care Health |
Outperform |
15.39% |
$269.04M |
3.73% |
| Premier |
Neutral |
-12.45% |
$198.56M |
1.21% |
Key Takeaway:
GeneDx Hldgs ranks at the top for Revenue Growth with 45.63%, outperforming its peers. It also leads in Gross Profit at $70.90M. However, it ranks lower for Return on Equity at 4.04%. Overall, GeneDx Hldgs is positioned favorably compared to its peers in this analysis.
All You Need to Know About GeneDx Hldgs
GeneDx Holdings Corp delivers personalized and actionable health insights to inform diagnosis, direct treatment and improve drug discovery. The company is uniquely positioned to accelerate the use of genomic and large-scale clinical information to enable precision medicine as the standard of care. The company is at the forefront of transforming healthcare through its various exome and genome testing and interpretation, fueled by one of the world's substantial rare disease data sets.
Financial Insights: GeneDx Hldgs
Market Capitalization Perspectives: The company's market capitalization falls below industry averages, signaling a relatively smaller size compared to peers. This positioning may be influenced by factors such as perceived growth potential or operational scale.
Revenue Growth: Over the 3 months period, GeneDx Hldgs showcased positive performance, achieving a revenue growth rate of 45.63% as of 30 June, 2025. This reflects a substantial increase in the company's top-line earnings. As compared to its peers, the company achieved a growth rate higher than the average among peers in Health Care sector.
Net Margin: GeneDx Hldgs's net margin surpasses industry standards, highlighting the company's exceptional financial performance. With an impressive 10.53% net margin, the company effectively manages costs and achieves strong profitability.
Return on Equity (ROE): GeneDx Hldgs's financial strength is reflected in its exceptional ROE, which exceeds industry averages. With a remarkable ROE of 4.04%, the company showcases efficient use of equity capital and strong financial health.
Return on Assets (ROA): GeneDx Hldgs's financial strength is reflected in its exceptional ROA, which exceeds industry averages. With a remarkable ROA of 2.37%, the company showcases efficient use of assets and strong financial health.
Debt Management: GeneDx Hldgs's debt-to-equity ratio is below industry norms, indicating a sound financial structure with a ratio of 0.41.
To track all earnings releases for GeneDx Hldgs visit their earnings calendar on our site.
This article was generated by Benzinga's automated content engine and reviewed by an editor.
Posted In: WGS


