Exploring Entergy's Earnings Expectations
Author: Benzinga Insights | October 28, 2025 01:02pm
Entergy (NYSE:ETR) is preparing to release its quarterly earnings on Wednesday, 2025-10-29. Here's a brief overview of what investors should keep in mind before the announcement.
Analysts expect Entergy to report an earnings per share (EPS) of $1.45.
The announcement from Entergy is eagerly anticipated, with investors seeking news of surpassing estimates and favorable guidance for the next quarter.
It's worth noting for new investors that guidance can be a key determinant of stock price movements.
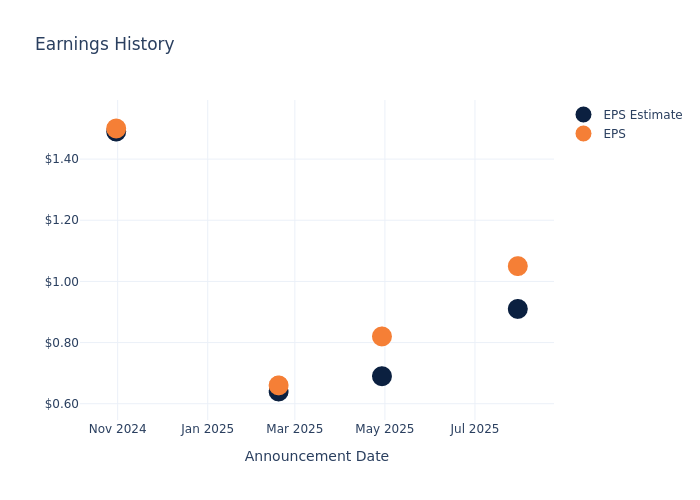
Past Earnings Performance
Last quarter the company beat EPS by $0.14, which was followed by a 1.28% increase in the share price the next day.
Here's a look at Entergy's past performance and the resulting price change:
| Quarter |
Q2 2025 |
Q1 2025 |
Q4 2024 |
Q3 2024 |
| EPS Estimate |
0.91 |
0.69 |
0.64 |
1.49 |
| EPS Actual |
1.05 |
0.82 |
0.66 |
1.50 |
| Price Change % |
1.00 |
0.00 |
0.00 |
-6.00 |
Tracking Entergy's Stock Performance
Shares of Entergy were trading at $97.36 as of October 27. Over the last 52-week period, shares are up 42.46%. Given that these returns are generally positive, long-term shareholders are likely bullish going into this earnings release.
Analyst Insights on Entergy
For investors, grasping market sentiments and expectations in the industry is vital. This analysis explores the latest insights regarding Entergy.
A total of 15 analyst ratings have been received for Entergy, with the consensus rating being Outperform. The average one-year price target stands at $101.0, suggesting a potential 3.74% upside.
Understanding Analyst Ratings Among Peers
The below comparison of the analyst ratings and average 1-year price targets of Xcel Energy, Exelon and PG&E, three prominent players in the industry, gives insights for their relative performance expectations and market positioning.
- Analysts currently favor an Outperform trajectory for Xcel Energy, with an average 1-year price target of $84.15, suggesting a potential 13.57% downside.
- Analysts currently favor an Neutral trajectory for Exelon, with an average 1-year price target of $51.5, suggesting a potential 47.1% downside.
- Analysts currently favor an Neutral trajectory for PG&E, with an average 1-year price target of $20.5, suggesting a potential 78.94% downside.
Key Findings: Peer Analysis Summary
Within the peer analysis summary, vital metrics for Xcel Energy, Exelon and PG&E are presented, shedding light on their respective standings within the industry and offering valuable insights into their market positions and comparative performance.
| Company |
Consensus |
Revenue Growth |
Gross Profit |
Return on Equity |
| Entergy |
Outperform |
12.70% |
$1.56B |
2.98% |
| Xcel Energy |
Outperform |
8.55% |
$1.56B |
2.18% |
| Exelon |
Neutral |
1.23% |
$2.21B |
1.42% |
| PG&E |
Neutral |
5.20% |
$2.46B |
2.74% |
Key Takeaway:
Entergy ranks highest in Revenue Growth among its peers. It also leads in Gross Profit margin. However, it has the lowest Return on Equity. Overall, Entergy is positioned favorably compared to its peers in terms of revenue growth and gross profit, but lags behind in return on equity.
Discovering Entergy: A Closer Look
Entergy is a holding company with five regulated integrated utilities that generate and distribute electricity to about 3 million customers in Arkansas, Louisiana, Mississippi, and Texas. It is one of the largest power producers in the country with 24 gigawatts of rate-regulated owned and leased power generation capacity. Entergy was the second-largest nuclear owner in the US before it began retiring and selling its plants in the Northeast in 2014. It sold its two small gas utilities in Louisiana in 2025.
Entergy: A Financial Overview
Market Capitalization Analysis: The company's market capitalization is below the industry average, suggesting that it is relatively smaller compared to peers. This could be due to various factors, including perceived growth potential or operational scale.
Revenue Growth: Over the 3 months period, Entergy showcased positive performance, achieving a revenue growth rate of 12.7% as of 30 June, 2025. This reflects a substantial increase in the company's top-line earnings. In comparison to its industry peers, the company stands out with a growth rate higher than the average among peers in the Utilities sector.
Net Margin: The company's net margin is a standout performer, exceeding industry averages. With an impressive net margin of 14.06%, the company showcases strong profitability and effective cost control.
Return on Equity (ROE): Entergy's ROE surpasses industry standards, highlighting the company's exceptional financial performance. With an impressive 2.98% ROE, the company effectively utilizes shareholder equity capital.
Return on Assets (ROA): Entergy's ROA surpasses industry standards, highlighting the company's exceptional financial performance. With an impressive 0.69% ROA, the company effectively utilizes its assets for optimal returns.
Debt Management: The company faces challenges in debt management with a debt-to-equity ratio higher than the industry average. With a ratio of 1.88, caution is advised due to increased financial risk.
To track all earnings releases for Entergy visit their earnings calendar on our site.
This article was generated by Benzinga's automated content engine and reviewed by an editor.
Posted In: ETR


