An Overview of XPO's Earnings
Author: Benzinga Insights | October 29, 2025 01:03pm
XPO (NYSE:XPO) is preparing to release its quarterly earnings on Thursday, 2025-10-30. Here's a brief overview of what investors should keep in mind before the announcement.
Analysts expect XPO to report an earnings per share (EPS) of $1.02.
Anticipation surrounds XPO's announcement, with investors hoping to hear about both surpassing estimates and receiving positive guidance for the next quarter.
New investors should understand that while earnings performance is important, market reactions are often driven by guidance.
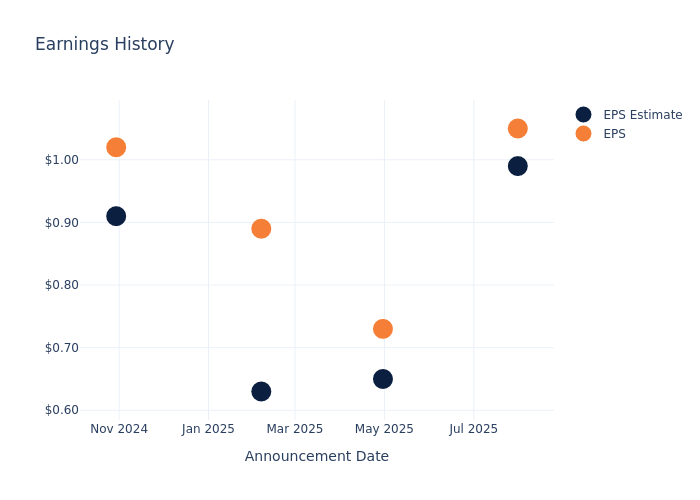
Performance in Previous Earnings
During the last quarter, the company reported an EPS beat by $0.06, leading to a 1.25% drop in the share price on the subsequent day.
Here's a look at XPO's past performance and the resulting price change:
| Quarter |
Q2 2025 |
Q1 2025 |
Q4 2024 |
Q3 2024 |
| EPS Estimate |
0.99 |
0.65 |
0.63 |
0.91 |
| EPS Actual |
1.05 |
0.73 |
0.89 |
1.02 |
| Price Change % |
-1.00 |
-2.00 |
1.00 |
-3.00 |
Performance of XPO Shares
Shares of XPO were trading at $123.66 as of October 28. Over the last 52-week period, shares are down 2.55%. Given that these returns are generally negative, long-term shareholders are likely a little upset going into this earnings release.
Analyst Opinions on XPO
For investors, staying informed about market sentiments and expectations in the industry is paramount. This analysis provides an exploration of the latest insights on XPO.
The consensus rating for XPO is Buy, based on 12 analyst ratings. With an average one-year price target of $135.17, there's a potential 9.31% upside.
Peer Ratings Comparison
The below comparison of the analyst ratings and average 1-year price targets of and JB Hunt Transport Servs, three prominent players in the industry, gives insights for their relative performance expectations and market positioning.
- Analysts currently favor an Neutral trajectory for JB Hunt Transport Servs, with an average 1-year price target of $161.04, suggesting a potential 30.23% upside.
Comprehensive Peer Analysis Summary
The peer analysis summary offers a detailed examination of key metrics for and JB Hunt Transport Servs, providing valuable insights into their respective standings within the industry and their market positions and comparative performance.
| Company |
Consensus |
Revenue Growth |
Gross Profit |
Return on Equity |
| XPO |
Buy |
0.05% |
$268M |
6.20% |
| JB Hunt Transport Servs |
Neutral |
4.26% |
$513.64M |
4.73% |
Key Takeaway:
XPO ranks higher in Revenue Growth compared to its peers. However, it lags behind in Gross Profit and Return on Equity. Overall, XPO is positioned in the middle among its peers based on the provided metrics.
Discovering XPO: A Closer Look
Following the spinoff of its contract logistics division (GXO) in 2021 and freight brokerage operations (RXO) in 2022, XPO is moving closer to becoming a pure-play asset-based less-than-truckload carrier. We estimate LTL shipping makes up 60% of total revenue, with XPO's European truckload and LTL operations making up 40%. However, XPO's LTL segment EBITDA mix is much higher than 60%. We believe XPO intends to divest its European trucking division once it finds the right buyer.
Unraveling the Financial Story of XPO
Market Capitalization: Boasting an elevated market capitalization, the company surpasses industry averages. This signals substantial size and strong market recognition.
Revenue Growth: Over the 3 months period, XPO showcased positive performance, achieving a revenue growth rate of 0.05% as of 30 June, 2025. This reflects a substantial increase in the company's top-line earnings. In comparison to its industry peers, the company trails behind with a growth rate lower than the average among peers in the Industrials sector.
Net Margin: XPO's net margin surpasses industry standards, highlighting the company's exceptional financial performance. With an impressive 5.1% net margin, the company effectively manages costs and achieves strong profitability.
Return on Equity (ROE): XPO's financial strength is reflected in its exceptional ROE, which exceeds industry averages. With a remarkable ROE of 6.2%, the company showcases efficient use of equity capital and strong financial health.
Return on Assets (ROA): XPO's ROA stands out, surpassing industry averages. With an impressive ROA of 1.32%, the company demonstrates effective utilization of assets and strong financial performance.
Debt Management: XPO's debt-to-equity ratio is notably higher than the industry average. With a ratio of 2.34, the company relies more heavily on borrowed funds, indicating a higher level of financial risk.
To track all earnings releases for XPO visit their earnings calendar on our site.
This article was generated by Benzinga's automated content engine and reviewed by an editor.
Posted In: XPO


