Earnings Preview: W.W. Grainger
Author: Benzinga Insights | October 30, 2025 10:01am
W.W. Grainger (NYSE:GWW) is set to give its latest quarterly earnings report on Friday, 2025-10-31. Here's what investors need to know before the announcement.
Analysts estimate that W.W. Grainger will report an earnings per share (EPS) of $9.94.
The market awaits W.W. Grainger's announcement, with hopes high for news of surpassing estimates and providing upbeat guidance for the next quarter.
It's important for new investors to understand that guidance can be a significant driver of stock prices.
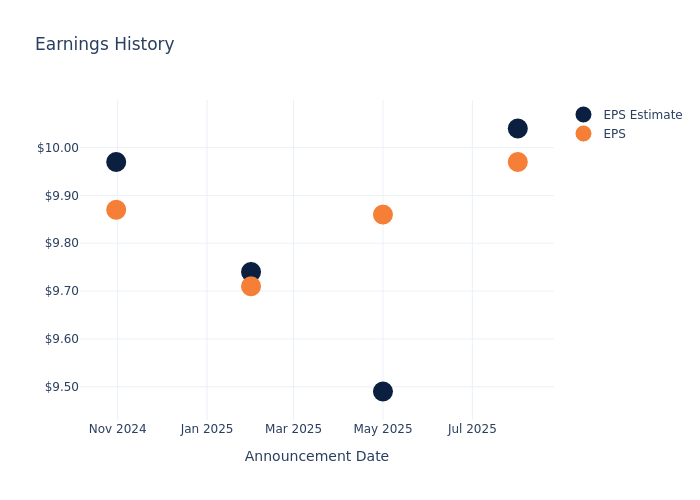
Past Earnings Performance
In the previous earnings release, the company missed EPS by $0.07, leading to a 0.0% drop in the share price the following trading session.
Here's a look at W.W. Grainger's past performance and the resulting price change:
| Quarter |
Q2 2025 |
Q1 2025 |
Q4 2024 |
Q3 2024 |
| EPS Estimate |
10.04 |
9.49 |
9.74 |
9.97 |
| EPS Actual |
9.97 |
9.86 |
9.71 |
9.87 |
| Price Change % |
-10.00 |
1.00 |
-6.00 |
0.00 |
W.W. Grainger Share Price Analysis
Shares of W.W. Grainger were trading at $958.97 as of October 29. Over the last 52-week period, shares are down 11.84%. Given that these returns are generally negative, long-term shareholders are likely bearish going into this earnings release.
Analyst Opinions on W.W. Grainger
For investors, staying informed about market sentiments and expectations in the industry is paramount. This analysis provides an exploration of the latest insights on W.W. Grainger.
Analysts have given W.W. Grainger a total of 5 ratings, with the consensus rating being Neutral. The average one-year price target is $1001.0, indicating a potential 4.38% upside.
Understanding Analyst Ratings Among Peers
In this analysis, we delve into the analyst ratings and average 1-year price targets of Fastenal, Ferguson Enterprises and United Rentals, three key industry players, offering insights into their relative performance expectations and market positioning.
- Analysts currently favor an Neutral trajectory for Fastenal, with an average 1-year price target of $48.75, suggesting a potential 94.92% downside.
- Analysts currently favor an Outperform trajectory for Ferguson Enterprises, with an average 1-year price target of $251.44, suggesting a potential 73.78% downside.
- Analysts currently favor an Outperform trajectory for United Rentals, with an average 1-year price target of $1049.0, suggesting a potential 9.39% upside.
Analysis Summary for Peers
The peer analysis summary outlines pivotal metrics for Fastenal, Ferguson Enterprises and United Rentals, demonstrating their respective standings within the industry and offering valuable insights into their market positions and comparative performance.
| Company |
Consensus |
Revenue Growth |
Gross Profit |
Return on Equity |
| W.W. Grainger |
Neutral |
5.61% |
$1.75B |
13.48% |
| Fastenal |
Neutral |
11.68% |
$965.80M |
8.71% |
| Ferguson Enterprises |
Outperform |
6.93% |
$2.69B |
12.32% |
| United Rentals |
Outperform |
5.94% |
$1.67B |
7.77% |
Key Takeaway:
W.W. Grainger ranks in the middle for revenue growth among its peers. It is at the bottom for gross profit. The company is at the top for return on equity.
Unveiling the Story Behind W.W. Grainger
Founded in 1927, W.W. Grainger originally distributed various motors via a mail-order catalogue. Over the course of the 20th century, the firm expanded into new industrial product categories and launched its first digital catalogue in 1995. Today, the company organizes itself into two segments focused on different customer bases. Its larger segment, high-touch solutions, offers a vast array of maintenance, repair, and operations, or MRO, supplies and bespoke inventory management services to larger businesses. Its smaller segment, endless assortment, operates two online platforms, Zoro and MonotaRO, that offer comprehensive catalogues of MRO supplies to smaller businesses. Grainger has operations throughout the world but primarily generates sales within the US.
W.W. Grainger's Economic Impact: An Analysis
Market Capitalization Analysis: Above industry benchmarks, the company's market capitalization emphasizes a noteworthy size, indicative of a strong market presence.
Revenue Growth: W.W. Grainger's remarkable performance in 3 months is evident. As of 30 June, 2025, the company achieved an impressive revenue growth rate of 5.61%. This signifies a substantial increase in the company's top-line earnings. As compared to its peers, the revenue growth lags behind its industry peers. The company achieved a growth rate lower than the average among peers in Industrials sector.
Net Margin: W.W. Grainger's net margin lags behind industry averages, suggesting challenges in maintaining strong profitability. With a net margin of 10.58%, the company may face hurdles in effective cost management.
Return on Equity (ROE): W.W. Grainger's ROE excels beyond industry benchmarks, reaching 13.48%. This signifies robust financial management and efficient use of shareholder equity capital.
Return on Assets (ROA): W.W. Grainger's financial strength is reflected in its exceptional ROA, which exceeds industry averages. With a remarkable ROA of 5.48%, the company showcases efficient use of assets and strong financial health.
Debt Management: W.W. Grainger's debt-to-equity ratio is below the industry average at 0.74, reflecting a lower dependency on debt financing and a more conservative financial approach.
To track all earnings releases for W.W. Grainger visit their earnings calendar on our site.
This article was generated by Benzinga's automated content engine and reviewed by an editor.
Posted In: GWW


