A Peek at Diamondback Energy's Future Earnings
Author: Benzinga Insights | October 31, 2025 10:01am
Diamondback Energy (NASDAQ:FANG) is gearing up to announce its quarterly earnings on Monday, 2025-11-03. Here's a quick overview of what investors should know before the release.
Analysts are estimating that Diamondback Energy will report an earnings per share (EPS) of $2.91.
The announcement from Diamondback Energy is eagerly anticipated, with investors seeking news of surpassing estimates and favorable guidance for the next quarter.
It's worth noting for new investors that guidance can be a key determinant of stock price movements.
Overview of Past Earnings
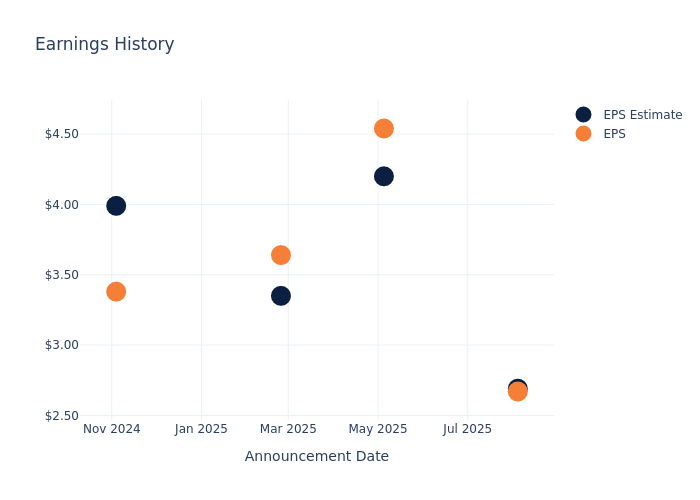
Last quarter the company missed EPS by $0.02, which was followed by a 1.42% drop in the share price the next day.
Here's a look at Diamondback Energy's past performance and the resulting price change:
| Quarter |
Q2 2025 |
Q1 2025 |
Q4 2024 |
Q3 2024 |
| EPS Estimate |
2.69 |
4.20 |
3.35 |
3.99 |
| EPS Actual |
2.67 |
4.54 |
3.64 |
3.38 |
| Price Change % |
-1.00 |
-1.00 |
-2.00 |
-2.00 |
Market Performance of Diamondback Energy's Stock
Shares of Diamondback Energy were trading at $142.15 as of October 30. Over the last 52-week period, shares are down 19.93%. Given that these returns are generally negative, long-term shareholders are likely unhappy going into this earnings release.
Analyst Views on Diamondback Energy
Understanding market sentiments and expectations within the industry is crucial for investors. This analysis delves into the latest insights on Diamondback Energy.
A total of 15 analyst ratings have been received for Diamondback Energy, with the consensus rating being Outperform. The average one-year price target stands at $187.4, suggesting a potential 31.83% upside.
Peer Ratings Comparison
The below comparison of the analyst ratings and average 1-year price targets of EQT, EOG Resources and Expand Energy, three prominent players in the industry, gives insights for their relative performance expectations and market positioning.
- Analysts currently favor an Buy trajectory for EQT, with an average 1-year price target of $66.33, suggesting a potential 53.34% downside.
- Analysts currently favor an Neutral trajectory for EOG Resources, with an average 1-year price target of $141.77, suggesting a potential 0.27% downside.
- Analysts currently favor an Outperform trajectory for Expand Energy, with an average 1-year price target of $134.67, suggesting a potential 5.26% downside.
Key Findings: Peer Analysis Summary
In the peer analysis summary, key metrics for EQT, EOG Resources and Expand Energy are highlighted, providing an understanding of their respective standings within the industry and offering insights into their market positions and comparative performance.
| Company |
Consensus |
Revenue Growth |
Gross Profit |
Return on Equity |
| Diamondback Energy |
Outperform |
47.63% |
$1.26B |
1.81% |
| EQT |
Buy |
49.78% |
$598.67M |
1.51% |
| EOG Resources |
Neutral |
-11.18% |
$3.45B |
4.58% |
| Expand Energy |
Outperform |
359.29% |
$1.45B |
3.03% |
Key Takeaway:
Diamondback Energy ranks at the top for Revenue Growth among its peers. It is in the middle for Gross Profit. For Return on Equity, it is at the bottom.
About Diamondback Energy
Diamondback Energy is an independent oil and gas producer in the United States. The company operates exclusively in the Permian Basin. At the end of 2024, the company reported net proven reserves of 3.6 billion barrels of oil equivalent. Net production averaged about 598,000 barrels per day in 2024, at a ratio of 56% oil, 23% natural gas liquids, and 21% natural gas.
Breaking Down Diamondback Energy's Financial Performance
Market Capitalization Analysis: The company's market capitalization is above the industry average, indicating that it is relatively larger in size compared to peers. This may suggest a higher level of investor confidence and market recognition.
Revenue Growth: Diamondback Energy's revenue growth over a period of 3 months has been noteworthy. As of 30 June, 2025, the company achieved a revenue growth rate of approximately 47.63%. This indicates a substantial increase in the company's top-line earnings. As compared to competitors, the company surpassed expectations with a growth rate higher than the average among peers in the Energy sector.
Net Margin: Diamondback Energy's net margin is below industry averages, indicating potential challenges in maintaining strong profitability. With a net margin of 19.15%, the company may face hurdles in effective cost management.
Return on Equity (ROE): Diamondback Energy's ROE lags behind industry averages, suggesting challenges in maximizing returns on equity capital. With an ROE of 1.81%, the company may face hurdles in achieving optimal financial performance.
Return on Assets (ROA): Diamondback Energy's ROA is below industry standards, pointing towards difficulties in efficiently utilizing assets. With an ROA of 0.98%, the company may encounter challenges in delivering satisfactory returns from its assets.
Debt Management: Diamondback Energy's debt-to-equity ratio is below industry norms, indicating a sound financial structure with a ratio of 0.39.
To track all earnings releases for Diamondback Energy visit their earnings calendar on our site.
This article was generated by Benzinga's automated content engine and reviewed by an editor.
Posted In: FANG


