Preview: Corebridge Financial's Earnings
Author: Benzinga Insights | October 31, 2025 10:02am
Corebridge Financial (NYSE:CRBG) is preparing to release its quarterly earnings on Monday, 2025-11-03. Here's a brief overview of what investors should keep in mind before the announcement.
Analysts expect Corebridge Financial to report an earnings per share (EPS) of $1.08.
Corebridge Financial bulls will hope to hear the company announce they've not only beaten that estimate, but also to provide positive guidance, or forecasted growth, for the next quarter.
New investors should note that it is sometimes not an earnings beat or miss that most affects the price of a stock, but the guidance (or forecast).
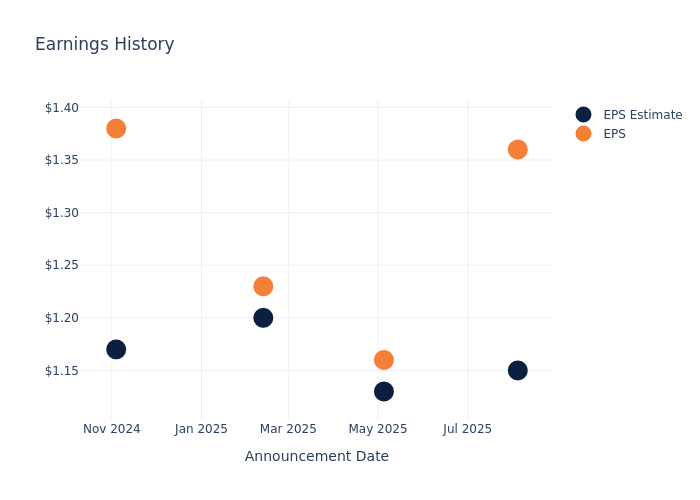
Past Earnings Performance
Last quarter the company beat EPS by $0.21, which was followed by a 1.41% drop in the share price the next day.
Here's a look at Corebridge Financial's past performance and the resulting price change:
| Quarter |
Q2 2025 |
Q1 2025 |
Q4 2024 |
Q3 2024 |
| EPS Estimate |
1.15 |
1.13 |
1.20 |
1.17 |
| EPS Actual |
1.36 |
1.16 |
1.23 |
1.38 |
| Price Change % |
-1.00 |
2.00 |
-2.00 |
-5.00 |
Tracking Corebridge Financial's Stock Performance
Shares of Corebridge Financial were trading at $31.75 as of October 30. Over the last 52-week period, shares are up 2.12%. Given that these returns are generally positive, long-term shareholders are likely bullish going into this earnings release.
Analyst Observations about Corebridge Financial
Understanding market sentiments and expectations within the industry is crucial for investors. This analysis delves into the latest insights on Corebridge Financial.
Analysts have provided Corebridge Financial with 6 ratings, resulting in a consensus rating of Outperform. The average one-year price target stands at $41.17, suggesting a potential 29.67% upside.
Understanding Analyst Ratings Among Peers
The below comparison of the analyst ratings and average 1-year price targets of and Apollo Asset Management, three prominent players in the industry, gives insights for their relative performance expectations and market positioning.
Peers Comparative Analysis Summary
The peer analysis summary presents essential metrics for and Apollo Asset Management, unveiling their respective standings within the industry and providing valuable insights into their market positions and comparative performance.
| Company |
Consensus |
Revenue Growth |
Gross Profit |
Return on Equity |
| Apollo Asset Management |
Outperform |
13.23% |
$6.48B |
1.69% |
Key Takeaway:
Corebridge Financial is positioned in the middle among its peers for Consensus rating. It ranks at the bottom for Revenue Growth, indicating lower growth compared to peers. In terms of Gross Profit, Corebridge Financial is at the bottom, suggesting lower profitability. Additionally, it is at the bottom for Return on Equity, reflecting lower returns compared to its peers.
All You Need to Know About Corebridge Financial
Corebridge Financial Inc provides retirement solutions and insurance products in the United States. It offers a broad set of products and services through five segments Individual Retirement, Group Retirement, Life Insurance, Institutional Markets businesses, Corporate and Other. The majority of its revenue derives from the Individual Retirement segment.
Unraveling the Financial Story of Corebridge Financial
Market Capitalization Analysis: Positioned below industry benchmarks, the company's market capitalization faces constraints in size. This could be influenced by factors such as growth expectations or operational capacity.
Revenue Challenges: Corebridge Financial's revenue growth over 3 months faced difficulties. As of 30 June, 2025, the company experienced a decline of approximately -19.33%. This indicates a decrease in top-line earnings. In comparison to its industry peers, the company trails behind with a growth rate lower than the average among peers in the Financials sector.
Net Margin: Corebridge Financial's net margin lags behind industry averages, suggesting challenges in maintaining strong profitability. With a net margin of -21.97%, the company may face hurdles in effective cost management.
Return on Equity (ROE): Corebridge Financial's ROE lags behind industry averages, suggesting challenges in maximizing returns on equity capital. With an ROE of -5.44%, the company may face hurdles in achieving optimal financial performance.
Return on Assets (ROA): The company's ROA is below industry benchmarks, signaling potential difficulties in efficiently utilizing assets. With an ROA of -0.17%, the company may need to address challenges in generating satisfactory returns from its assets.
Debt Management: Corebridge Financial's debt-to-equity ratio is below the industry average. With a ratio of 0.92, the company relies less on debt financing, maintaining a healthier balance between debt and equity, which can be viewed positively by investors.
To track all earnings releases for Corebridge Financial visit their earnings calendar on our site.
This article was generated by Benzinga's automated content engine and reviewed by an editor.
Posted In: CRBG


