A Preview Of Freshpet's Earnings
Author: Benzinga Insights | October 31, 2025 12:01pm
Freshpet (NASDAQ:FRPT) is set to give its latest quarterly earnings report on Monday, 2025-11-03. Here's what investors need to know before the announcement.
Analysts estimate that Freshpet will report an earnings per share (EPS) of $0.41.
The market awaits Freshpet's announcement, with hopes high for news of surpassing estimates and providing upbeat guidance for the next quarter.
It's important for new investors to understand that guidance can be a significant driver of stock prices.
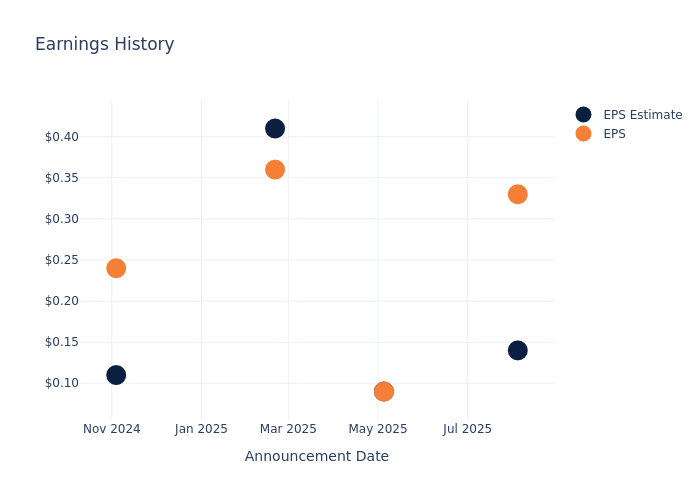
Historical Earnings Performance
The company's EPS beat by $0.19 in the last quarter, leading to a 3.67% drop in the share price on the following day.
Here's a look at Freshpet's past performance and the resulting price change:
| Quarter |
Q2 2025 |
Q1 2025 |
Q4 2024 |
Q3 2024 |
| EPS Estimate |
0.14 |
0.09 |
0.41 |
0.11 |
| EPS Actual |
0.33 |
0.09 |
0.36 |
0.24 |
| Price Change % |
-4.00 |
2.00 |
-6.00 |
1.00 |
Market Performance of Freshpet's Stock
Shares of Freshpet were trading at $50.6 as of October 30. Over the last 52-week period, shares are down 66.29%. Given that these returns are generally negative, long-term shareholders are likely upset going into this earnings release.
Analyst Insights on Freshpet
For investors, staying informed about market sentiments and expectations in the industry is paramount. This analysis provides an exploration of the latest insights on Freshpet.
A total of 10 analyst ratings have been received for Freshpet, with the consensus rating being Neutral. The average one-year price target stands at $66.3, suggesting a potential 31.03% upside.
Peer Ratings Overview
In this comparison, we explore the analyst ratings and average 1-year price targets of Flowers Foods, Simply Good Foods and Nomad Foods, three prominent industry players, offering insights into their relative performance expectations and market positioning.
- Analysts currently favor an Neutral trajectory for Flowers Foods, with an average 1-year price target of $15.0, suggesting a potential 70.36% downside.
- Analysts currently favor an Neutral trajectory for Simply Good Foods, with an average 1-year price target of $27.25, suggesting a potential 46.15% downside.
- Analysts currently favor an Buy trajectory for Nomad Foods, with an average 1-year price target of $18.5, suggesting a potential 63.44% downside.
Snapshot: Peer Analysis
In the peer analysis summary, key metrics for Flowers Foods, Simply Good Foods and Nomad Foods are highlighted, providing an understanding of their respective standings within the industry and offering insights into their market positions and comparative performance.
| Company |
Consensus |
Revenue Growth |
Gross Profit |
Return on Equity |
| Freshpet |
Neutral |
12.51% |
$108.19M |
1.54% |
| Flowers Foods |
Neutral |
1.46% |
$606.77M |
4.11% |
| Simply Good Foods |
Neutral |
-1.77% |
$126.61M |
-0.68% |
| Nomad Foods |
Buy |
-0.82% |
$206.30M |
2.21% |
Key Takeaway:
Freshpet is positioned in the middle among its peers for revenue growth. It ranks at the bottom for gross profit and return on equity.
Discovering Freshpet: A Closer Look
Freshpet produces and sells premium fresh pet food through its company-owned refrigerators placed in grocery, mass and club, pet specialty, and natural stores. Freshpet primarily targets dogs (96% of 2024 sales), with cats and treats comprising the rest of its sales. Geographically, the company's home US market, where all its food is produced, accounts for about 98% of sales, with exports to Canada, the United Kingdom, and other European countries accounting for the remaining balance.
Breaking Down Freshpet's Financial Performance
Market Capitalization Analysis: Reflecting a smaller scale, the company's market capitalization is positioned below industry averages. This could be attributed to factors such as growth expectations or operational capacity.
Revenue Growth: Freshpet displayed positive results in 3 months. As of 30 June, 2025, the company achieved a solid revenue growth rate of approximately 12.51%. This indicates a notable increase in the company's top-line earnings. When compared to others in the Consumer Staples sector, the company excelled with a growth rate higher than the average among peers.
Net Margin: The company's net margin is below industry benchmarks, signaling potential difficulties in achieving strong profitability. With a net margin of 6.18%, the company may need to address challenges in effective cost control.
Return on Equity (ROE): Freshpet's ROE falls below industry averages, indicating challenges in efficiently using equity capital. With an ROE of 1.54%, the company may face hurdles in generating optimal returns for shareholders.
Return on Assets (ROA): Freshpet's ROA lags behind industry averages, suggesting challenges in maximizing returns from its assets. With an ROA of 1.02%, the company may face hurdles in achieving optimal financial performance.
Debt Management: Freshpet's debt-to-equity ratio is below industry norms, indicating a sound financial structure with a ratio of 0.46.
To track all earnings releases for Freshpet visit their earnings calendar on our site.
This article was generated by Benzinga's automated content engine and reviewed by an editor.
Posted In: FRPT


