Author: Gianni di Poce | November 02, 2025 01:31pm
Market Overview
Stocks were up across the board last week, and weathered numerous headlines including a rate cut, a trade meeting between the U.S. and China, as well as earnings season. The Nasdaq led the way higher, closing up 2.24%. The Dow Jones Industrial Average followed, closing up 0.74%. The S&P 500 rallied 0.71%. Precious metals continued their correction, but I have the most attention now on crypto, which looks to be attempting to complete a bottom.
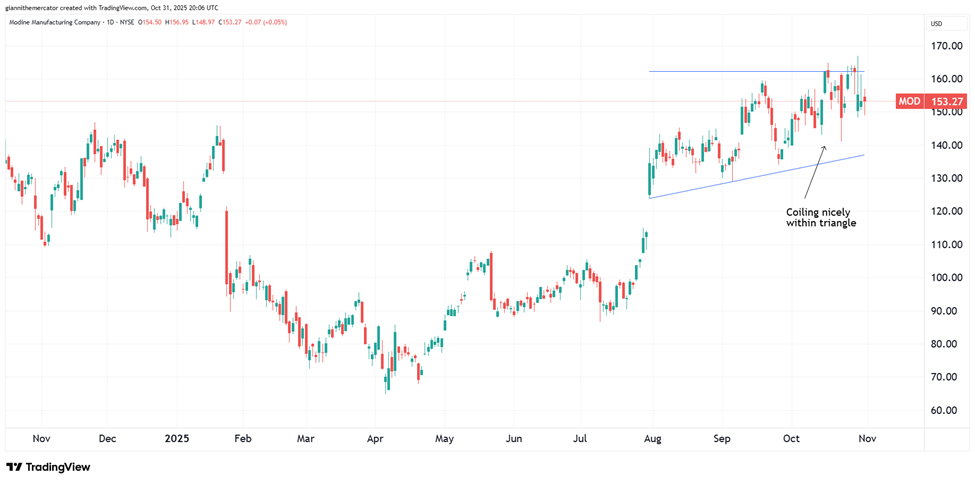
Modine Manufacturing Company (MOD) is a leading global provider of thermal management solutions for automotive, commercial, and industrial applications, offering investors exposure to the rapidly growing energy-efficient technology and electrification sector with a focus on innovative heat transfer systems and sustainable solutions.
The prior quarter showed revenue of $682.8 million and earnings of $56.92 million.
This valuation on MOD is high. P/E is at 46.71, Price-to-Sales is at 3.37, and EV to EBITDA is at 25.21.
At a technical level, MOD has built a beautiful base within a triangle formation. If it can get above the upper trendline of the pattern, look for much more upside in this name.
Why It's Happening
Modine Manufacturing Company is riding a wave of explosive growth in the AI-driven data center cooling market, with its advanced thermal management solutions powering the infrastructure behind the global AI boom. Q1 2026 sales rose 3% year-over-year, driven by surging demand for its precision cooling systems, positioning Modine as a critical enabler of the multi-trillion-dollar AI revolution.
Strategic focus on high-margin products enhances Modine's profitability narrative. By applying the 80/20 principle to prioritize high-growth, high-return markets like data centers and EV thermal systems, the company boosted its gross margin to 24.8% and EBIT margin to 10.7%, creating a compelling story of operational efficiency and sustainable earnings growth.
Global diversification and sustainability leadership strengthen Modine's market position. Its thermal management systems support automotive, construction, HVAC, and industrial machinery sectors worldwide, with a focus on eco-friendly solutions that align with rising ESG demands, making it a go-to partner for industries seeking performance and environmental responsibility.
Resilience amid market challenges underscores Modine's adaptability. Despite a 32% year-over-year drop in North American Class 8 truck orders in September 2025, the company's diversified portfolio and focus on AI and EV markets provide a buffer, positioning it to navigate macroeconomic headwinds while capitalizing on long-term growth trends.
Analyst Ratings:
Oppenheimer: Outperform
Keybanc: Overweight
DA Davidson: Buy
My Action Plan (50% Return Potential)
I am bullish on MOD above $140.00-$142.00. My upside target is $230.00-$235.00.
Centuri Holdings, Inc. (CTRI) is a leading utility infrastructure services company in North America, providing gas and electric utility services for infrastructure modernization, offering investors exposure to the rapidly growing energy infrastructure and clean energy transition sector with a focus on maintenance, repair, and installation for utility providers.
The most recent quarterly report showed revenue of $724.05 million and earnings of $16.92 million.
Valuation is mixed in CTRI. Price-to-Sales is a solid 0.67, while EV to EBITDA is at 11.37. Book Value is just 6.39.
From a technical standpoint, CTRI is building up a solid cup and handle pattern. A break above resistance would lead to a massive acceleration in upside momentum.
Why It's Happening
Centuri Holdings Inc. is at the forefront of the U.S. energy transition, securing nearly $400 million in new customer awards in September 2025 for utility capital plans, infrastructure upgrades, and grid hardening projects. This momentum builds on over $550 million in contracts from July, fueling a robust backlog that positions Centuri as an essential partner in modernizing the nation’s aging grid amid surging demand for reliable power infrastructure.
Operational independence from Southwest Gas unlocks Centuri’s full growth potential. The completion of its final separation in September 2025, including a 27.36 million share secondary offering priced at $19.60, provides clean ownership structure and fresh capital access, allowing the company to aggressively pursue expansion in the $100 billion+ utility infrastructure services market without legacy constraints.
Strong revenue outlook and market positioning highlight Centuri’s scalability. Q2 2025 revenues climbed 7.7% to $724.1 million, with FY25 guidance raised to $2.7-$2.85 billion—outpacing the sector’s 6% capex growth—driven by long-term master service agreements and a focus on high-margin grid modernization, creating a narrative of sustained earnings expansion in a utility sector ripe for investment.
Activist investor backing from Carl Icahn signals undervaluation and upside potential. Icahn’s passive stake rose to 12.24% in September 2025, reflecting confidence in Centuri’s strategic execution and value creation post-spin-off, positioning the company to attract further institutional interest as a compelling play in the resilient utility infrastructure space.
Analyst Ratings:
Wells Fargo: Overweight
Baird: Outperform
My Action Plan (49% Return Potential)
I am bullish on CTRI above $17.50-$18.00. My upside target is $30.00-$32.00.
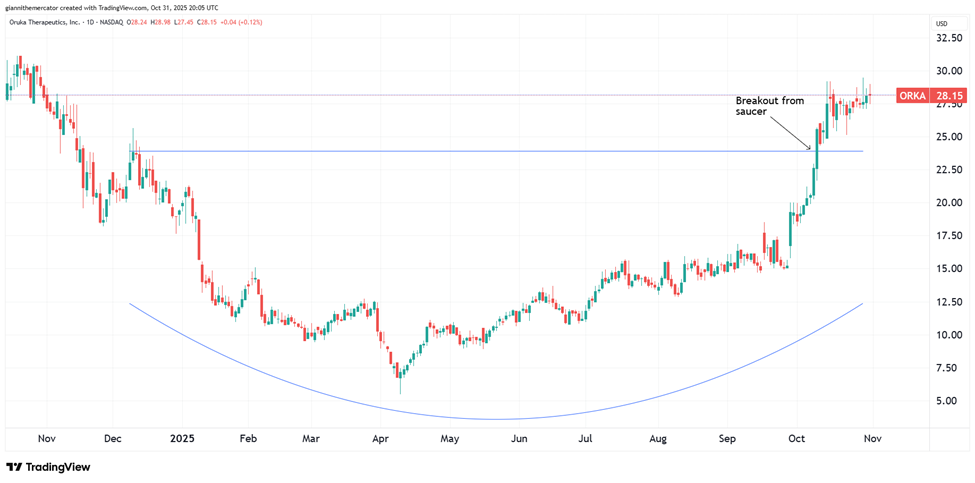
Oruka Therapeutics, Inc. (ORKA) is a leading clinical-stage biotechnology company developing novel monoclonal antibody therapeutics for psoriasis and other inflammatory and immunology indications, offering investors exposure to the rapidly growing autoimmune disease treatment sector with a focus on innovative, long-acting IL-23 and IL-17 inhibitors.
The company has no revenue and in the latest quarter, reported a loss of $24.57 million.
Valuation in ORKA is abysmal since it has no earnings. It's a highly speculative biotech name.
From a charting standpoint, ORKA recently broke out from a massive saucer formation. I'm looking for a lot more upside in this name in the coming months.
Why It's Happening
Oruka Therapeutics Inc. is pioneering a new era in psoriasis treatment with its lead candidate ORKA-001, a novel half-life extended anti-IL-23p19 antibody demonstrating a groundbreaking 100-day half-life in Phase 1 trials, enabling potential once-yearly dosing that far surpasses current standards like AbbVie’s Skyrizi. This innovation addresses the chronic burden of frequent injections for millions of patients, positioning Oruka to capture a significant share of the $30 billion psoriasis market as it advances to Phase 2a in late 2025 with efficacy data expected in 2026.
Robust pipeline expansion bolsters Oruka’s growth narrative in inflammatory diseases. Co-lead program ORKA-002, targeting IL-17A/F for psoriasis and psoriatic arthritis, has begun dosing in Phase 1 with preclinical data showing over 30-day half-life for two-to-three times yearly dosing, while ORKA-003 and combination ORKA-021 target undisclosed pathways—creating a diversified portfolio that could redefine care for underserved patients in dermatology and beyond.
Strategic merger and funding firepower provide a solid foundation for accelerated development. The 2024 merger with ARCA biopharma, backed by Paragon Therapeutics’ antibody engineering expertise, combined with over $455 million raised—including a $180 million private placement in September 2025—ensures a cash runway through 2027, fueling clinical milestones and positioning Oruka as a well-resourced contender in the competitive biologics landscape.
Unmet need in chronic skin diseases underscores Oruka’s mission-driven potential. With plaque psoriasis affecting 125 million globally and current therapies requiring monthly injections, Oruka’s focus on high-efficacy, infrequent dosing aligns with patient demands for greater freedom, backed by a scientific advisory board led by dermatology expert Andrew Blauvelt, enhancing its credibility in tackling this high-burden condition.
Analyst Ratings:
Guggenheim: Buy
HC Wainwright: Buy
Barclays: Overweight
My Action Plan (96% Return Potential)
I am bullish on ORKA above $22.00-$23.00. My upside target is $55.00-$56.00.
Market-Moving Catalysts for the Week Ahead
What's to Worry About Next?
It was an eventful week filled with earnings, a rate cut from the Fed, and a formalized trade truce with China. Meanwhile, stocks climbed to new all-time highs again, but started exhibiting a bit of churn underneath the surface.
A lot of market commentators are pointing out the weak breadth, and how the Magnificent Seven names are carrying the indices higher. Well, that's what happens when these companies are as big as they are. The lagging breadth is only a worry of those other stocks fail to play catch up in the near-future.
The Fed raised some concerns last week about the next rate cut not being so certain, but I'm just not buying that right now. The job market continues to weaken, and inflation remains under control. This is the environment to cut rates.
Eyes on King Dollar
The U.S. Dollar has been making quite the comeback over the past few weeks. It bottomed against the Euro back in mid-September, and bottomed against the Japanese Yen way back in April. The sustained rebound against the Yen begs the question – is the carry trade back?
The carry trade occurs when speculators short the lower-yielding currency to buy the higher-yielding currency. Despite recent rate cuts, the Dollar is still yielding notably more than both the Yen and the Euro, but the carry trade against the Yen is notorious for its secondary effects.
The carry trade in the Yen is often used to finance speculation in tech names. Thus, we could add this to the long list of reasons to be overweight the tech sector, although I still think that biotech will emerge as the next story on the AI front in 2026.
Sector & Industry Strength
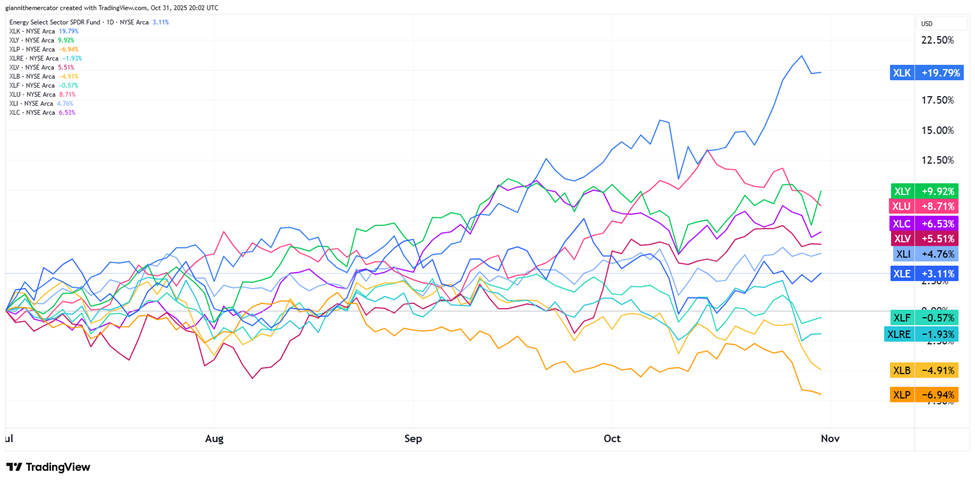
The market's sector internals continue to guide us in accordance with the money flows – the bulls just can't stop winning right now, as technology (XLK) solidifies its place as the leader in the pack.
There was a huge pop in consumer discretionary (XLY) last week because of Amazon too. This brought this additional growth sector into second place in the rankings going back to the start of the second quarter.
In last we still see consumer staples (XLP). This is bullish because you want to see defensive sectors underperforming, which is exactly what we see. I'm also starting to like the healthcare story more and more.
1 week
3 Weeks
13 Weeks
26 Weeks
Technology
Technology
Technology
Technology
Editor's Note:Tech continues to run the table.
Checking Back in on China (Sector ETF: FXI/SPY)
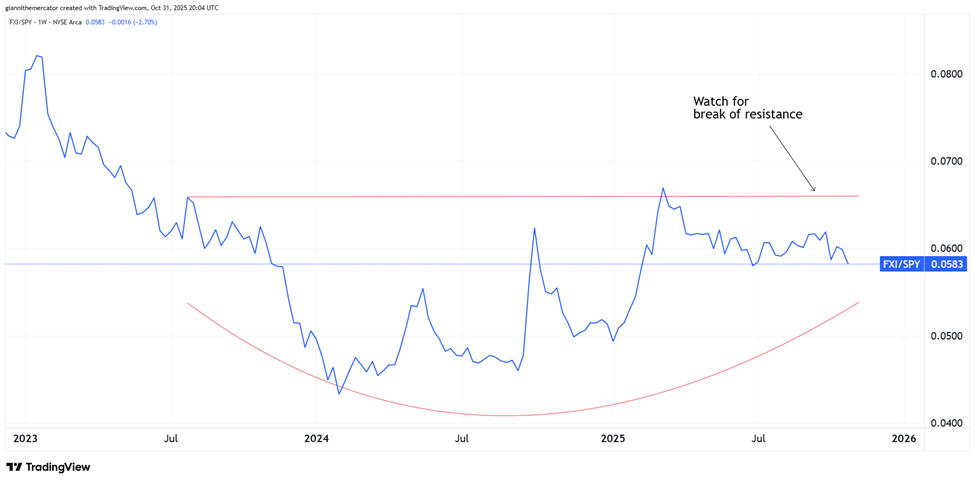
We're fresh off a huge trade deal between the U.S. and China. But underneath the surface, the flow of capital between the two countries tells the bigger story. It's what makes it a great time to check back in on the ratio between Chinese large cap stocks (FXI) and U.S. large cap stocks (SPY).
I've been talking a lot about the mounting opportunities in the Chinese market, and I think we finally have a catalyst for this to materialize. As you can see FXI has quietly outperformed SPY since the start of 2024 – it's just not being covered in the headlines.
The ratio is still coiling within the rounding bottom formation. I'm looking for a break above the upper horizontal trendline of the pattern to confirm that the Chinese market is going to ignite to the upside. This could be a major theme of 2026.
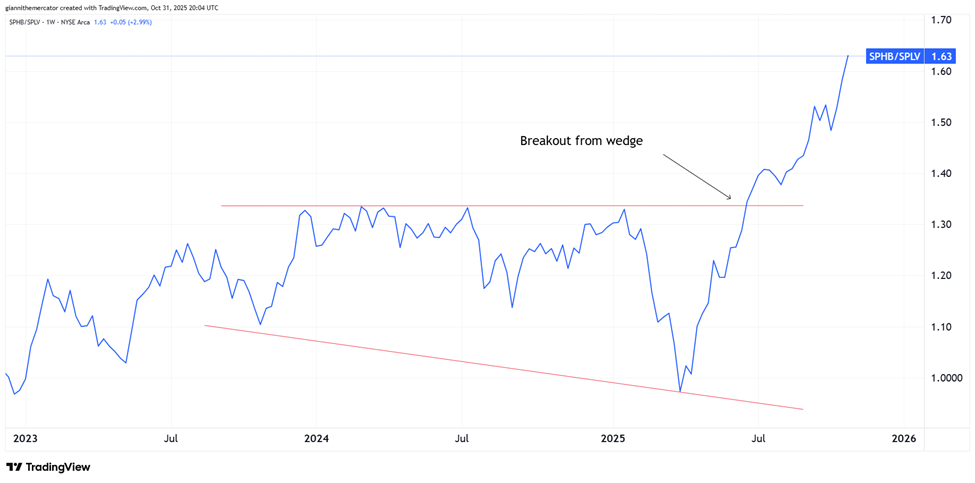
High-Beta Says a Lot (Sector ETF: SPHB/SPLV)
It really pays to look to see what's going on underneath the surface. The truth always lies in the tape, and it pays handsomely to monitor it closely. I'm looking at the ratio between high beta stocks (SPHB) and low volatility stocks (SPLV).
Note how the ratio was dropping hard into the lows of April, but then, it formed a v-bottom and began a parabolic rise. It broke out from a broadening wedge formation back in late-June, and has never looked back since.
As look as this ratio continues to climb, the market is going to reward those that take risks. An uptrend in this ratio is very much a hallmark of a bull market in equities. If we start seeing it drop again, it would suggest that it's appropriate to dial back on the risk.
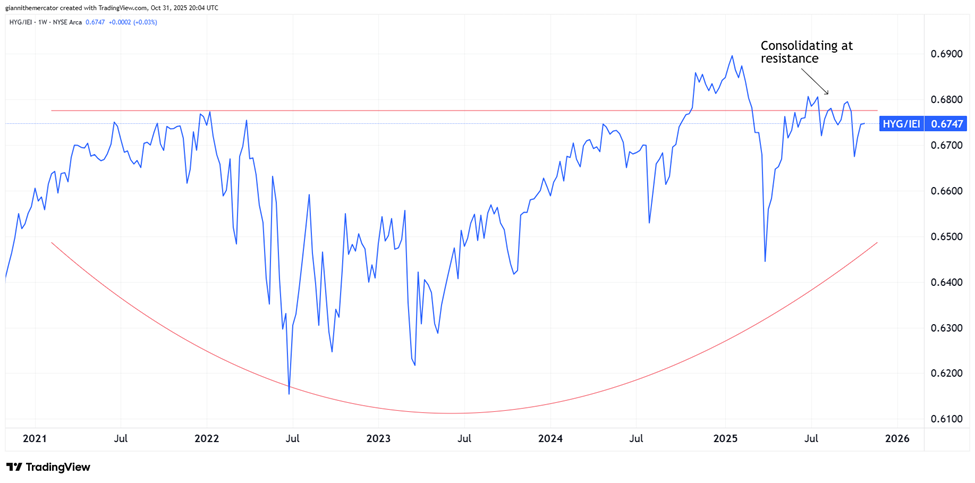
Junk Bonds Are Readying (Sector ETF: HYG/IEI)
I want to shift gears in the bond market and update you on how junk bonds (HYG) are performing relative to 3-7 Year Treasuries (IEI). This is a key indicator that helps measure both liquidity and risk appetite for the overall market.
Junk bonds have a reputation of trading similar to stocks with respect to volatility. But Treasuries are considered to be the safe haven asset (for now). Thus, when HYG outperforms IEI, it's considered a risk-on signal. When IEI outperforms HYG, it signals caution.
The ratio continues to consolidate near its all-time highs. But more importantly, we continue to observe the massive saucer formation. This points to a massive increase in market liquidity – this makes sense given the recent actions of the Fed.
My Take:
There's little reason to be concerned about a major market calamity as long as this ratio holds steady. Even less so if it starts to breakout from the saucer formation. Remember that credits tends to lead, and stocks then follow.
It's important to remember that all markets are connected – stocks, bonds, currencies, and commodities. Risks often present themselves in the "smarter" markets like currencies and bonds first, which is why, even if you're a stock trader, you need to be aware of what's going on elsewhere.
Cryptocurrency
Time to pivot and look at Bitcoin again this week, which continues to consolidate within the broadening wedge formation highlighted previously. To be clear – this pattern supports the bullish case, but only if prices can exceed the upper horizontal trendline.
This puts Bitcoin in a "new all-time highs or bust" situation. The concern now is that we have a potential lower-high on October 27, and following the fact that the low of October 17 exceeded the August 30 low, there are some mounting issues with the trend.
Bitcoin needs to reclaim the technical resistance zone in the 110,000-113,000 area to regain bullish momentum. There's plenty of support in the 100,000-105,000 zone for now, but we really don't want to see Bitcoin drop below that area.
Legal Disclosures:
This communication is provided for information purposes only.
This communication has been prepared based upon information, including market prices, data and other information, from sources believed to be reliable, but Benzinga does not warrant its completeness or accuracy except with respect to any disclosures relative to Benzinga and/or its affiliates and an analyst’s involvement with any company (or security, other financial product or other asset class) that may be the subject of this communication. Any opinions and estimates constitute our judgment as of the date of this material and are subject to change without notice. Past performance is not indicative of future results. This communication is not intended as an offer or solicitation for the purchase or sale of any financial instrument. Benzinga does not provide individually tailored investment advice. Any opinions and recommendations herein do not take into account individual client circumstances, objectives, or needs and are not intended as recommendations of particular securities, financial instruments or strategies to particular clients. You must make your own independent decisions regarding any securities, financial instruments or strategies mentioned or related to the information herein. Periodic updates may be provided on companies, issuers or industries based on specific developments or announcements, market conditions or any other publicly available information. However, Benzinga may be restricted from updating information contained in this communication for regulatory or other reasons. Clients should contact analysts and execute transactions through a Benzinga subsidiary or affiliate in their home jurisdiction unless governing law permits otherwise. This communication may not be redistributed or retransmitted, in whole or in part, or in any form or manner, without the express written consent of Benzinga. Any unauthorized use or disclosure is prohibited. Receipt and review of this information constitutes your agreement not to redistribute or retransmit the contents and information contained in this communication without first obtaining express permission from an authorized officer of Benzinga. Copyright 2022 Benzinga. All rights reserved.