Uber Technologies Earnings Preview
Author: Benzinga Insights | November 03, 2025 09:02am
Uber Technologies (NYSE:UBER) will release its quarterly earnings report on Tuesday, 2025-11-04. Here's a brief overview for investors ahead of the announcement.
Analysts anticipate Uber Technologies to report an earnings per share (EPS) of $0.68.
The market awaits Uber Technologies's announcement, with hopes high for news of surpassing estimates and providing upbeat guidance for the next quarter.
It's important for new investors to understand that guidance can be a significant driver of stock prices.
Overview of Past Earnings
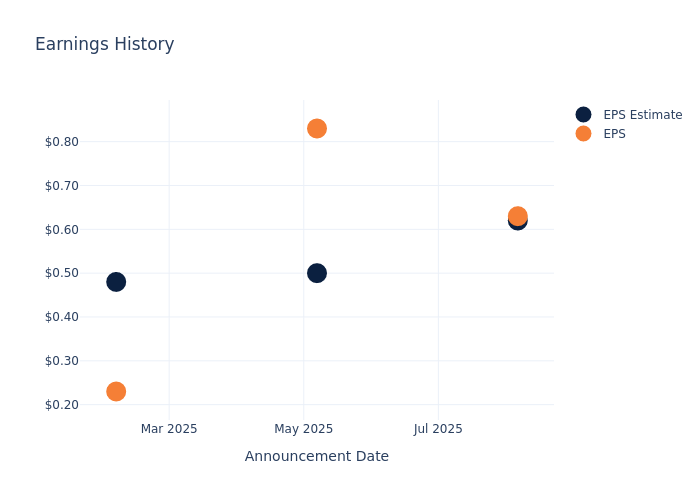
The company's EPS beat by $0.01 in the last quarter, leading to a 3.87% increase in the share price on the following day.
Here's a look at Uber Technologies's past performance and the resulting price change:
| Quarter |
Q2 2025 |
Q1 2025 |
Q4 2024 |
Q3 2024 |
| EPS Estimate |
0.62 |
0.50 |
0.48 |
0.41 |
| EPS Actual |
0.63 |
0.83 |
0.23 |
0.46 |
| Price Change % |
4.00 |
-2.00 |
9.00 |
2.00 |
Uber Technologies Share Price Analysis
Shares of Uber Technologies were trading at $96.5 as of October 31. Over the last 52-week period, shares are up 30.14%. Given that these returns are generally positive, long-term shareholders should be satisfied going into this earnings release.
Analyst Insights on Uber Technologies
For investors, staying informed about market sentiments and expectations in the industry is paramount. This analysis provides an exploration of the latest insights on Uber Technologies.
A total of 15 analyst ratings have been received for Uber Technologies, with the consensus rating being Outperform. The average one-year price target stands at $118.2, suggesting a potential 22.49% upside.
Comparing Ratings Among Industry Peers
The following analysis focuses on the analyst ratings and average 1-year price targets of Grab Holdings and Lyft, three prominent industry players, providing insights into their relative performance expectations and market positioning.
- Analysts currently favor an Neutral trajectory for Grab Holdings, with an average 1-year price target of $6.2, suggesting a potential 93.58% downside.
- Analysts currently favor an Neutral trajectory for Lyft, with an average 1-year price target of $19.53, suggesting a potential 79.76% downside.
Comprehensive Peer Analysis Summary
The peer analysis summary offers a detailed examination of key metrics for Grab Holdings and Lyft, providing valuable insights into their respective standings within the industry and their market positions and comparative performance.
| Company |
Consensus |
Revenue Growth |
Gross Profit |
Return on Equity |
| Uber Technologies |
Outperform |
18.23% |
$5.04B |
6.08% |
| Grab Holdings |
Neutral |
23.34% |
$354M |
0.55% |
| Lyft |
Neutral |
10.61% |
$652.45M |
5.13% |
Key Takeaway:
Uber Technologies is positioned at the top for Revenue Growth among its peers. In terms of Gross Profit, it is also leading the group. However, its Return on Equity is lower compared to the others.
All You Need to Know About Uber Technologies
Uber Technologies is a technology provider that matches riders with drivers, hungry people with restaurants and food couriers, and shippers with carriers. The firm's on-demand technology platform is currently utilized by traditional cars as well as autonomous vehicles, but could eventually be used for additional products and services, such as delivery via drones or electronic vehicle take-off and landing (eVTOL) technology. Uber operates in over 70 countries, with over 180 million users who order rides or food at least once a month.
Uber Technologies's Financial Performance
Market Capitalization Highlights: Above the industry average, the company's market capitalization signifies a significant scale, indicating strong confidence and market prominence.
Revenue Growth: Over the 3 months period, Uber Technologies showcased positive performance, achieving a revenue growth rate of 18.23% as of 30 June, 2025. This reflects a substantial increase in the company's top-line earnings. When compared to others in the Industrials sector, the company faces challenges, achieving a growth rate lower than the average among peers.
Net Margin: Uber Technologies's net margin excels beyond industry benchmarks, reaching 10.71%. This signifies efficient cost management and strong financial health.
Return on Equity (ROE): Uber Technologies's ROE stands out, surpassing industry averages. With an impressive ROE of 6.08%, the company demonstrates effective use of equity capital and strong financial performance.
Return on Assets (ROA): Uber Technologies's ROA surpasses industry standards, highlighting the company's exceptional financial performance. With an impressive 2.49% ROA, the company effectively utilizes its assets for optimal returns.
Debt Management: Uber Technologies's debt-to-equity ratio is notably higher than the industry average. With a ratio of 0.55, the company relies more heavily on borrowed funds, indicating a higher level of financial risk.
To track all earnings releases for Uber Technologies visit their earnings calendar on our site.
This article was generated by Benzinga's automated content engine and reviewed by an editor.
Posted In: UBER


