A Glimpse of Marathon Petroleum's Earnings Potential
Author: Benzinga Insights | November 03, 2025 09:02am
Marathon Petroleum (NYSE:MPC) is gearing up to announce its quarterly earnings on Tuesday, 2025-11-04. Here's a quick overview of what investors should know before the release.
Analysts are estimating that Marathon Petroleum will report an earnings per share (EPS) of $3.14.
Marathon Petroleum bulls will hope to hear the company announce they've not only beaten that estimate, but also to provide positive guidance, or forecasted growth, for the next quarter.
New investors should note that it is sometimes not an earnings beat or miss that most affects the price of a stock, but the guidance (or forecast).
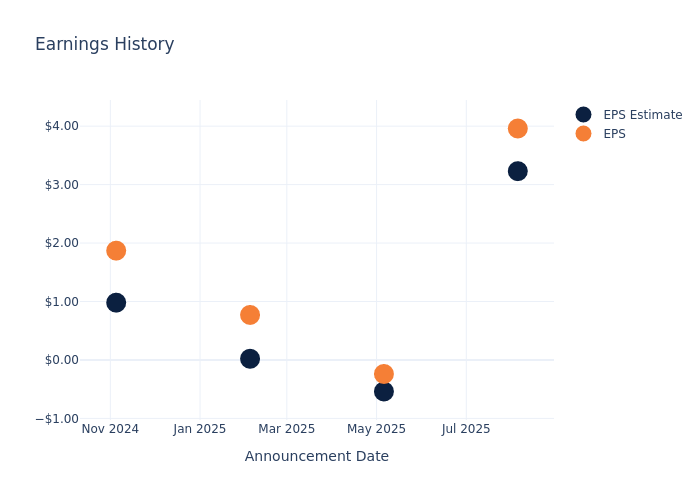
Past Earnings Performance
Last quarter the company beat EPS by $0.73, which was followed by a 3.84% drop in the share price the next day.
Here's a look at Marathon Petroleum's past performance and the resulting price change:
| Quarter |
Q2 2025 |
Q1 2025 |
Q4 2024 |
Q3 2024 |
| EPS Estimate |
3.23 |
-0.54 |
0.02 |
0.98 |
| EPS Actual |
3.96 |
-0.24 |
0.77 |
1.87 |
| Price Change % |
-4.00 |
0.00 |
0.00 |
4.00 |
Tracking Marathon Petroleum's Stock Performance
Shares of Marathon Petroleum were trading at $194.91 as of October 30. Over the last 52-week period, shares are up 30.32%. Given that these returns are generally positive, long-term shareholders are likely bullish going into this earnings release.
Analysts' Perspectives on Marathon Petroleum
Understanding market sentiments and expectations within the industry is crucial for investors. This analysis delves into the latest insights on Marathon Petroleum.
The consensus rating for Marathon Petroleum is Outperform, derived from 11 analyst ratings. An average one-year price target of $202.82 implies a potential 4.06% upside.
Understanding Analyst Ratings Among Peers
The analysis below examines the analyst ratings and average 1-year price targets of Phillips 66, Valero Energy and HF Sinclair, three significant industry players, providing valuable insights into their relative performance expectations and market positioning.
- Analysts currently favor an Neutral trajectory for Phillips 66, with an average 1-year price target of $149.47, suggesting a potential 23.31% downside.
- Analysts currently favor an Outperform trajectory for Valero Energy, with an average 1-year price target of $186.5, suggesting a potential 4.31% downside.
- Analysts currently favor an Buy trajectory for HF Sinclair, with an average 1-year price target of $59.67, suggesting a potential 69.39% downside.
Summary of Peers Analysis
In the peer analysis summary, key metrics for Phillips 66, Valero Energy and HF Sinclair are highlighted, providing an understanding of their respective standings within the industry and offering insights into their market positions and comparative performance.
| Company |
Consensus |
Revenue Growth |
Gross Profit |
Return on Equity |
| Marathon Petroleum |
Outperform |
-10.85% |
$2.98B |
7.37% |
| Phillips 66 |
Neutral |
-2.85% |
$3.47B |
0.48% |
| Valero Energy |
Outperform |
-2.15% |
$1.76B |
4.57% |
| HF Sinclair |
Buy |
0.61% |
$673M |
4.28% |
Key Takeaway:
Marathon Petroleum ranks at the bottom for Revenue Growth among its peers. It is also at the bottom for Gross Profit. However, it is at the top for Return on Equity.
Unveiling the Story Behind Marathon Petroleum
Marathon Petroleum is an independent refiner with 13 refineries in the midcontinent, West Coast, and Gulf Coast of the United States with total throughput capacity of 3.0 million barrels per day. Its Dickinson, North Dakota, facility produces 184 million gallons a year of renewable diesel. Its Martinez, California, facility has the ability to produce 730 million gallons a year of renewable diesel. The firm also owns and operates midstream assets primarily through its listed master limited partnership, MPLX.
Understanding the Numbers: Marathon Petroleum's Finances
Market Capitalization Analysis: Above industry benchmarks, the company's market capitalization emphasizes a noteworthy size, indicative of a strong market presence.
Decline in Revenue: Over the 3 months period, Marathon Petroleum faced challenges, resulting in a decline of approximately -10.85% in revenue growth as of 30 June, 2025. This signifies a reduction in the company's top-line earnings. When compared to others in the Energy sector, the company faces challenges, achieving a growth rate lower than the average among peers.
Net Margin: Marathon Petroleum's net margin is impressive, surpassing industry averages. With a net margin of 3.6%, the company demonstrates strong profitability and effective cost management.
Return on Equity (ROE): Marathon Petroleum's financial strength is reflected in its exceptional ROE, which exceeds industry averages. With a remarkable ROE of 7.37%, the company showcases efficient use of equity capital and strong financial health.
Return on Assets (ROA): Marathon Petroleum's ROA excels beyond industry benchmarks, reaching 1.52%. This signifies efficient management of assets and strong financial health.
Debt Management: Marathon Petroleum's debt-to-equity ratio is below the industry average at 1.81, reflecting a lower dependency on debt financing and a more conservative financial approach.
To track all earnings releases for Marathon Petroleum visit their earnings calendar on our site.
This article was generated by Benzinga's automated content engine and reviewed by an editor.
Posted In: MPC


