Earnings Outlook For Sphere Entertainment
Author: Benzinga Insights | November 03, 2025 01:02pm
Sphere Entertainment (NYSE:SPHR) is preparing to release its quarterly earnings on Tuesday, 2025-11-04. Here's a brief overview of what investors should keep in mind before the announcement.
Analysts expect Sphere Entertainment to report an earnings per share (EPS) of $-1.78.
Sphere Entertainment bulls will hope to hear the company announce they've not only beaten that estimate, but also to provide positive guidance, or forecasted growth, for the next quarter.
New investors should note that it is sometimes not an earnings beat or miss that most affects the price of a stock, but the guidance (or forecast).
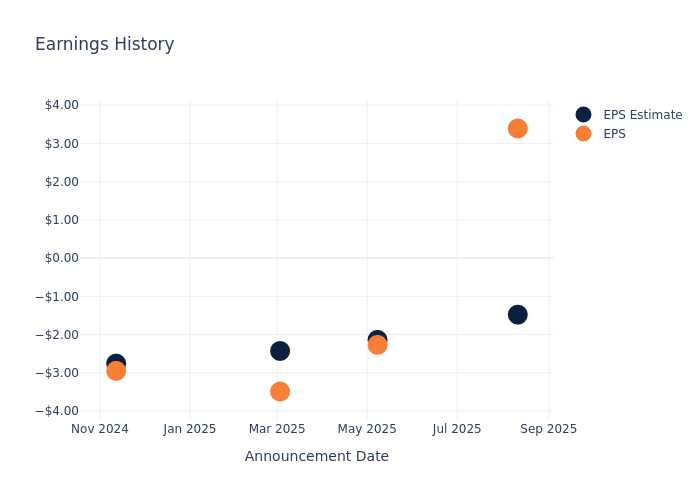
Historical Earnings Performance
During the last quarter, the company reported an EPS beat by $4.87, leading to a 0.16% increase in the share price on the subsequent day.
Here's a look at Sphere Entertainment's past performance and the resulting price change:
| Quarter |
Q2 2025 |
Q1 2025 |
Q2 2025 |
Q1 2025 |
| EPS Estimate |
-1.48 |
-2.14 |
-2.43 |
-2.76 |
| EPS Actual |
3.39 |
-2.27 |
-3.49 |
-2.95 |
| Price Change % |
0.00 |
3.00 |
0.00 |
2.00 |
Tracking Sphere Entertainment's Stock Performance
Shares of Sphere Entertainment were trading at $68.48 as of October 31. Over the last 52-week period, shares are up 53.97%. Given that these returns are generally positive, long-term shareholders should be satisfied going into this earnings release.
Analyst Insights on Sphere Entertainment
Understanding market sentiments and expectations within the industry is crucial for investors. This analysis delves into the latest insights on Sphere Entertainment.
The consensus rating for Sphere Entertainment is Buy, based on 6 analyst ratings. With an average one-year price target of $65.83, there's a potential 3.87% downside.
Understanding Analyst Ratings Among Peers
The below comparison of the analyst ratings and average 1-year price targets of and Sphere Entertainment, three prominent players in the industry, gives insights for their relative performance expectations and market positioning.
Insights: Peer Analysis
In the peer analysis summary, key metrics for and Sphere Entertainment are highlighted, providing an understanding of their respective standings within the industry and offering insights into their market positions and comparative performance.
| Company |
Consensus |
Revenue Growth |
Gross Profit |
Return on Equity |
| Sphere Entertainment |
Buy |
3.40% |
$151.36M |
6.81% |
Key Takeaway:
Sphere Entertainment is positioned at the top for Revenue Growth among its peers, with a growth rate of 3.40%. In terms of Gross Profit, Sphere Entertainment is also leading with a gross profit of $151.36M. However, its Return on Equity of 6.81% is below the average compared to its peers.
Get to Know Sphere Entertainment Better
Sphere Entertainment Co is a live entertainment and media company. The firm creates, writes, casts, produces, and tours shows and events. The group has two reportable segments which includeSphere and MSG Networks. Sphere is a next-generation entertainment medium, and MSG Networks operates two regional sports and entertainment networks, as well as a direct-to-consumer (DTC) and authenticated streaming product.
Unraveling the Financial Story of Sphere Entertainment
Market Capitalization Analysis: Positioned below industry benchmarks, the company's market capitalization faces constraints in size. This could be influenced by factors such as growth expectations or operational capacity.
Revenue Growth: Sphere Entertainment displayed positive results in 3 months. As of 30 June, 2025, the company achieved a solid revenue growth rate of approximately 3.4%. This indicates a notable increase in the company's top-line earnings. In comparison to its industry peers, the company trails behind with a growth rate lower than the average among peers in the Communication Services sector.
Net Margin: Sphere Entertainment's net margin is impressive, surpassing industry averages. With a net margin of 53.71%, the company demonstrates strong profitability and effective cost management.
Return on Equity (ROE): Sphere Entertainment's ROE excels beyond industry benchmarks, reaching 6.81%. This signifies robust financial management and efficient use of shareholder equity capital.
Return on Assets (ROA): Sphere Entertainment's ROA surpasses industry standards, highlighting the company's exceptional financial performance. With an impressive 3.51% ROA, the company effectively utilizes its assets for optimal returns.
Debt Management: Sphere Entertainment's debt-to-equity ratio is below the industry average. With a ratio of 0.44, the company relies less on debt financing, maintaining a healthier balance between debt and equity, which can be viewed positively by investors.
To track all earnings releases for Sphere Entertainment visit their earnings calendar on our site.
This article was generated by Benzinga's automated content engine and reviewed by an editor.
Posted In: SPHR


