What to Expect from Par Pacific Hldgs's Earnings
Author: Benzinga Insights | November 03, 2025 01:03pm
Par Pacific Hldgs (NYSE:PARR) is set to give its latest quarterly earnings report on Tuesday, 2025-11-04. Here's what investors need to know before the announcement.
Analysts estimate that Par Pacific Hldgs will report an earnings per share (EPS) of $1.97.
The market awaits Par Pacific Hldgs's announcement, with hopes high for news of surpassing estimates and providing upbeat guidance for the next quarter.
It's important for new investors to understand that guidance can be a significant driver of stock prices.
Overview of Past Earnings
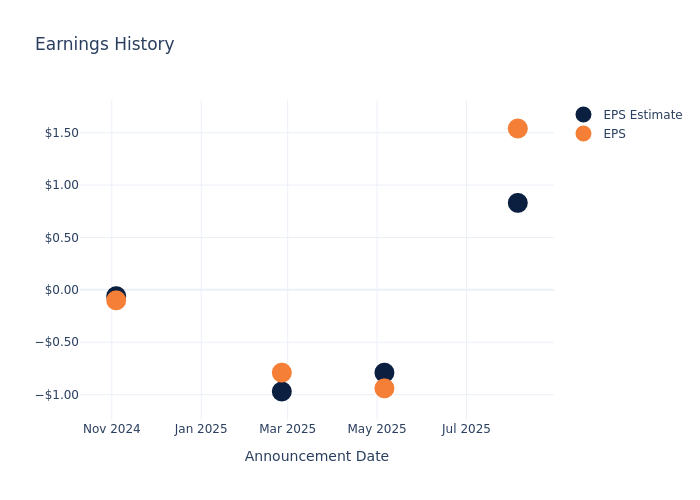
During the last quarter, the company reported an EPS beat by $0.71, leading to a 11.12% drop in the share price on the subsequent day.
Here's a look at Par Pacific Hldgs's past performance and the resulting price change:
| Quarter |
Q2 2025 |
Q1 2025 |
Q4 2024 |
Q3 2024 |
| EPS Estimate |
0.83 |
-0.79 |
-0.97 |
-0.06 |
| EPS Actual |
1.54 |
-0.94 |
-0.79 |
-0.10 |
| Price Change % |
-11.00 |
11.00 |
-10.00 |
-4.00 |
Stock Performance
Shares of Par Pacific Hldgs were trading at $39.98 as of October 31. Over the last 52-week period, shares are up 172.34%. Given that these returns are generally positive, long-term shareholders are likely bullish going into this earnings release.
Analysts' Take on Par Pacific Hldgs
For investors, staying informed about market sentiments and expectations in the industry is paramount. This analysis provides an exploration of the latest insights on Par Pacific Hldgs.
A total of 6 analyst ratings have been received for Par Pacific Hldgs, with the consensus rating being Neutral. The average one-year price target stands at $40.67, suggesting a potential 1.73% upside.
Comparing Ratings Among Industry Peers
The analysis below examines the analyst ratings and average 1-year price targets of Delek US Hldgs, World Kinect and Green Plains, three significant industry players, providing valuable insights into their relative performance expectations and market positioning.
- Analysts currently favor an Neutral trajectory for Delek US Hldgs, with an average 1-year price target of $33.62, suggesting a potential 15.91% downside.
- Analysts currently favor an Underperform trajectory for World Kinect, with an average 1-year price target of $26.0, suggesting a potential 34.97% downside.
- Analysts currently favor an Underperform trajectory for Green Plains, with an average 1-year price target of $10.0, suggesting a potential 74.99% downside.
Peer Analysis Summary
The peer analysis summary offers a detailed examination of key metrics for Delek US Hldgs, World Kinect and Green Plains, providing valuable insights into their respective standings within the industry and their market positions and comparative performance.
| Company |
Consensus |
Revenue Growth |
Gross Profit |
Return on Equity |
| Par Pacific Hldgs |
Neutral |
-6.15% |
$265.25M |
5.26% |
| Delek US Hldgs |
Neutral |
-16.43% |
$45.70M |
-117.31% |
| World Kinect |
Underperform |
-10.48% |
$249.60M |
1.60% |
| Green Plains |
Underperform |
-10.66% |
$41.57M |
-9.43% |
Key Takeaway:
Par Pacific Hldgs ranks at the top for Gross Profit and Return on Equity among its peers. However, it ranks at the bottom for Revenue Growth.
All You Need to Know About Par Pacific Hldgs
Par Pacific Holdings Inc is an oil and gas company that manages and maintains interests in energy and infrastructure businesses. The company has three reportable segments namely Refining, Under its refining business, the company produces ultra-low-sulfur diesel, gasoline, jet fuel, marine fuel, LSFO, and other associated refined products. Its Retail includes operation licenses out brands to serve the retail consumer. Through the Logistics segment, crude shipments are delivered to the refineries, in addition to finished products that are exported. It generates maximum revenue from the Refining segment.
Breaking Down Par Pacific Hldgs's Financial Performance
Market Capitalization Analysis: Falling below industry benchmarks, the company's market capitalization reflects a reduced size compared to peers. This positioning may be influenced by factors such as growth expectations or operational capacity.
Revenue Challenges: Par Pacific Hldgs's revenue growth over 3 months faced difficulties. As of 30 June, 2025, the company experienced a decline of approximately -6.15%. This indicates a decrease in top-line earnings. As compared to its peers, the revenue growth lags behind its industry peers. The company achieved a growth rate lower than the average among peers in Energy sector.
Net Margin: Par Pacific Hldgs's financial strength is reflected in its exceptional net margin, which exceeds industry averages. With a remarkable net margin of 3.14%, the company showcases strong profitability and effective cost management.
Return on Equity (ROE): Par Pacific Hldgs's ROE excels beyond industry benchmarks, reaching 5.26%. This signifies robust financial management and efficient use of shareholder equity capital.
Return on Assets (ROA): Par Pacific Hldgs's ROA surpasses industry standards, highlighting the company's exceptional financial performance. With an impressive 1.55% ROA, the company effectively utilizes its assets for optimal returns.
Debt Management: Par Pacific Hldgs's debt-to-equity ratio is below the industry average at 1.37, reflecting a lower dependency on debt financing and a more conservative financial approach.
To track all earnings releases for Par Pacific Hldgs visit their earnings calendar on our site.
This article was generated by Benzinga's automated content engine and reviewed by an editor.
Posted In: PARR


