A Peek at AES's Future Earnings
Author: Benzinga Insights | November 03, 2025 02:01pm
AES (NYSE:AES) is gearing up to announce its quarterly earnings on Tuesday, 2025-11-04. Here's a quick overview of what investors should know before the release.
Analysts are estimating that AES will report an earnings per share (EPS) of $0.77.
The announcement from AES is eagerly anticipated, with investors seeking news of surpassing estimates and favorable guidance for the next quarter.
It's worth noting for new investors that guidance can be a key determinant of stock price movements.
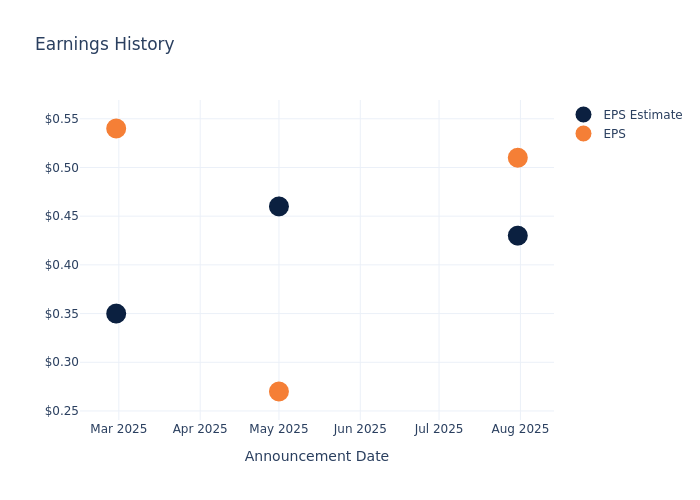
Earnings History Snapshot
The company's EPS beat by $0.08 in the last quarter, leading to a 1.97% increase in the share price on the following day.
Here's a look at AES's past performance and the resulting price change:
| Quarter |
Q2 2025 |
Q1 2025 |
Q4 2024 |
Q3 2024 |
| EPS Estimate |
0.43 |
0.46 |
0.35 |
0.64 |
| EPS Actual |
0.51 |
0.27 |
0.54 |
0.71 |
| Price Change % |
2.00 |
2.00 |
12.00 |
-10.00 |
Performance of AES Shares
Shares of AES were trading at $13.87 as of October 31. Over the last 52-week period, shares are down 12.22%. Given that these returns are generally negative, long-term shareholders are likely unhappy going into this earnings release.
Analyst Opinions on AES
For investors, grasping market sentiments and expectations in the industry is vital. This analysis explores the latest insights regarding AES.
With 4 analyst ratings, AES has a consensus rating of Outperform. The average one-year price target is $17.75, indicating a potential 27.97% upside.
Understanding Analyst Ratings Among Peers
The below comparison of the analyst ratings and average 1-year price targets of Central Puerto, Talen Energy and Hallador Energy, three prominent players in the industry, gives insights for their relative performance expectations and market positioning.
- Analysts currently favor an Buy trajectory for Central Puerto, with an average 1-year price target of $17.5, suggesting a potential 26.17% upside.
- Analysts currently favor an Outperform trajectory for Talen Energy, with an average 1-year price target of $452.5, suggesting a potential 3162.44% upside.
- Analysts currently favor an Buy trajectory for Hallador Energy, with an average 1-year price target of $20.0, suggesting a potential 44.2% upside.
Comprehensive Peer Analysis Summary
The peer analysis summary outlines pivotal metrics for Central Puerto, Talen Energy and Hallador Energy, demonstrating their respective standings within the industry and offering valuable insights into their market positions and comparative performance.
| Company |
Consensus |
Revenue Growth |
Gross Profit |
Return on Equity |
| AES |
Outperform |
-2.96% |
$453M |
-3.07% |
| Central Puerto |
Buy |
0.27% |
$59.69B |
4.02% |
| Talen Energy |
Outperform |
9.93% |
$94M |
5.94% |
| Hallador Energy |
Buy |
9.66% |
$56.70M |
6.95% |
Key Takeaway:
AES ranks at the bottom for Revenue Growth with a negative rate, while its peers show positive growth rates. In terms of Gross Profit, AES is at the bottom with the lowest figure. For Return on Equity, AES is also at the bottom compared to its peers. Overall, AES lags behind its peers in key financial metrics.
About AES
AES is a global power company that operates in 15 countries. Its generation portfolio totals over 32 gigawatts, including renewable energy (50%), gas (32%), coal (16%), and oil (2%). AES has majority ownership and operates six electric utilities distributing power to more than 2.5 million customers.
AES: Delving into Financials
Market Capitalization Analysis: Reflecting a smaller scale, the company's market capitalization is positioned below industry averages. This could be attributed to factors such as growth expectations or operational capacity.
Revenue Challenges: AES's revenue growth over 3 months faced difficulties. As of 30 June, 2025, the company experienced a decline of approximately -2.96%. This indicates a decrease in top-line earnings. As compared to its peers, the revenue growth lags behind its industry peers. The company achieved a growth rate lower than the average among peers in Utilities sector.
Net Margin: AES's net margin is below industry standards, pointing towards difficulties in achieving strong profitability. With a net margin of -3.68%, the company may encounter challenges in effective cost control.
Return on Equity (ROE): AES's ROE is below industry averages, indicating potential challenges in efficiently utilizing equity capital. With an ROE of -3.07%, the company may face hurdles in achieving optimal financial returns.
Return on Assets (ROA): AES's ROA lags behind industry averages, suggesting challenges in maximizing returns from its assets. With an ROA of -0.22%, the company may face hurdles in achieving optimal financial performance.
Debt Management: AES's debt-to-equity ratio is notably higher than the industry average. With a ratio of 8.99, the company relies more heavily on borrowed funds, indicating a higher level of financial risk.
To track all earnings releases for AES visit their earnings calendar on our site.
This article was generated by Benzinga's automated content engine and reviewed by an editor.
Posted In: AES


