A Preview Of Sunoco's Earnings
Author: Benzinga Insights | November 04, 2025 12:02pm
Sunoco (NYSE:SUN) will release its quarterly earnings report on Wednesday, 2025-11-05. Here's a brief overview for investors ahead of the announcement.
Analysts anticipate Sunoco to report an earnings per share (EPS) of $1.42.
Sunoco bulls will hope to hear the company announce they've not only beaten that estimate, but also to provide positive guidance, or forecasted growth, for the next quarter.
New investors should note that it is sometimes not an earnings beat or miss that most affects the price of a stock, but the guidance (or forecast).
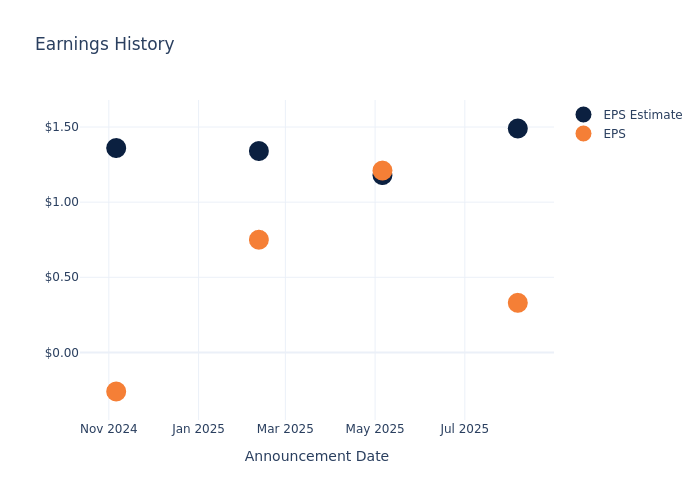
Earnings Track Record
During the last quarter, the company reported an EPS missed by $1.16, leading to a 2.8% drop in the share price on the subsequent day.
Here's a look at Sunoco's past performance and the resulting price change:
| Quarter |
Q2 2025 |
Q1 2025 |
Q4 2024 |
Q3 2024 |
| EPS Estimate |
1.49 |
1.18 |
1.34 |
1.36 |
| EPS Actual |
0.33 |
1.21 |
0.75 |
-0.26 |
| Price Change % |
-3.00 |
5.00 |
-2.00 |
-3.00 |
Performance of Sunoco Shares
Shares of Sunoco were trading at $51.59 as of November 03. Over the last 52-week period, shares are down 3.67%. Given that these returns are generally negative, long-term shareholders are likely bearish going into this earnings release.
Analysts' Take on Sunoco
Understanding market sentiments and expectations within the industry is crucial for investors. This analysis delves into the latest insights on Sunoco.
A total of 2 analyst ratings have been received for Sunoco, with the consensus rating being Outperform. The average one-year price target stands at $65.5, suggesting a potential 26.96% upside.
Analyzing Analyst Ratings Among Peers
The below comparison of the analyst ratings and average 1-year price targets of HF Sinclair, PBF Energy and CVR Energy, three prominent players in the industry, gives insights for their relative performance expectations and market positioning.
- Analysts currently favor an Buy trajectory for HF Sinclair, with an average 1-year price target of $60.08, suggesting a potential 16.46% upside.
- Analysts currently favor an Underperform trajectory for PBF Energy, with an average 1-year price target of $29.44, suggesting a potential 42.93% downside.
- Analysts currently favor an Sell trajectory for CVR Energy, with an average 1-year price target of $26.67, suggesting a potential 48.3% downside.
Analysis Summary for Peers
Within the peer analysis summary, vital metrics for HF Sinclair, PBF Energy and CVR Energy are presented, shedding light on their respective standings within the industry and offering valuable insights into their market positions and comparative performance.
| Company |
Consensus |
Revenue Growth |
Gross Profit |
Return on Equity |
| Sunoco |
Outperform |
-12.70% |
$415M |
1.09% |
| HF Sinclair |
Buy |
0.61% |
$673M |
4.28% |
| PBF Energy |
Underperform |
-8.72% |
$39.20M |
3.30% |
| CVR Energy |
Sell |
6.06% |
$558M |
57.27% |
Key Takeaway:
Sunoco ranks at the bottom for Revenue Growth with a decrease of 12.70%, while the top performer shows an increase of 6.06%. In terms of Gross Profit, Sunoco is at the bottom with $415M, compared to the top performer with $673M. Sunoco also ranks at the bottom for Return on Equity with 1.09%, while the top performer has 57.27%. Overall, Sunoco's performance is weaker compared to its peers in all key metrics.
All You Need to Know About Sunoco
Sunoco LP is engaged in the distribution of motor fuels to independent dealers, distributors, and other commercial customers as well as the distribution of motor fuels to end-use customers at retail sites operated by commission agents. It is a growth-oriented master limited partnership (MLP) that operates as a wholesale and retail fuel distributor in the United States. The firm operates through the Fuel Distribution; Pipeline Systems; and Terminals segments. It generates the majority of its revenue from the Fuel Distribution segment. It distributes motor fuel to convenience stores, dealers, and commercial customers in various states. The operating convenience stores are under the APlus, Stripes, Aloha Island Mart, and Tigermarket brands.
Unraveling the Financial Story of Sunoco
Market Capitalization: With restricted market capitalization, the company is positioned below industry averages. This reflects a smaller scale relative to peers.
Revenue Growth: Sunoco's revenue growth over a period of 3 months has faced challenges. As of 30 June, 2025, the company experienced a revenue decline of approximately -12.7%. This indicates a decrease in the company's top-line earnings. When compared to others in the Energy sector, the company faces challenges, achieving a growth rate lower than the average among peers.
Net Margin: Sunoco's financial strength is reflected in its exceptional net margin, which exceeds industry averages. With a remarkable net margin of 0.83%, the company showcases strong profitability and effective cost management.
Return on Equity (ROE): Sunoco's ROE surpasses industry standards, highlighting the company's exceptional financial performance. With an impressive 1.09% ROE, the company effectively utilizes shareholder equity capital.
Return on Assets (ROA): Sunoco's ROA excels beyond industry benchmarks, reaching 0.31%. This signifies efficient management of assets and strong financial health.
Debt Management: Sunoco's debt-to-equity ratio is below the industry average. With a ratio of 2.04, the company relies less on debt financing, maintaining a healthier balance between debt and equity, which can be viewed positively by investors.
To track all earnings releases for Sunoco visit their earnings calendar on our site.
This article was generated by Benzinga's automated content engine and reviewed by an editor.
Posted In: SUN


