Cinemark Hldgs Earnings Preview
Author: Benzinga Insights | November 04, 2025 01:02pm
Cinemark Hldgs (NYSE:CNK) is preparing to release its quarterly earnings on Wednesday, 2025-11-05. Here's a brief overview of what investors should keep in mind before the announcement.
Analysts expect Cinemark Hldgs to report an earnings per share (EPS) of $0.46.
Anticipation surrounds Cinemark Hldgs's announcement, with investors hoping to hear about both surpassing estimates and receiving positive guidance for the next quarter.
New investors should understand that while earnings performance is important, market reactions are often driven by guidance.
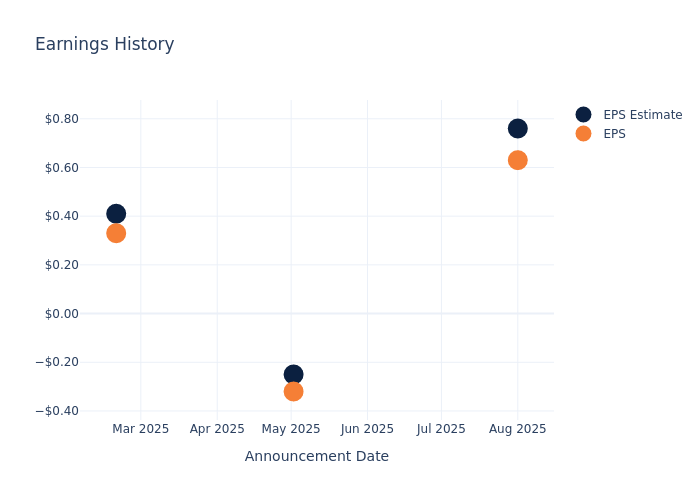
Earnings Track Record
Last quarter the company missed EPS by $0.13, which was followed by a 0.0% drop in the share price the next day.
Here's a look at Cinemark Hldgs's past performance and the resulting price change:
| Quarter |
Q2 2025 |
Q1 2025 |
Q4 2024 |
Q3 2024 |
| EPS Estimate |
0.76 |
-0.25 |
0.41 |
0.56 |
| EPS Actual |
0.63 |
-0.32 |
0.33 |
1.19 |
| Price Change % |
-4.00 |
1.00 |
-3.00 |
0.00 |
Tracking Cinemark Hldgs's Stock Performance
Shares of Cinemark Hldgs were trading at $26.74 as of November 03. Over the last 52-week period, shares are down 12.76%. Given that these returns are generally negative, long-term shareholders are likely a little upset going into this earnings release.
Analyst Observations about Cinemark Hldgs
For investors, staying informed about market sentiments and expectations in the industry is paramount. This analysis provides an exploration of the latest insights on Cinemark Hldgs.
A total of 3 analyst ratings have been received for Cinemark Hldgs, with the consensus rating being Outperform. The average one-year price target stands at $36.0, suggesting a potential 34.63% upside.
Understanding Analyst Ratings Among Peers
In this comparison, we explore the analyst ratings and average 1-year price targets of and Sphere Entertainment, three prominent industry players, offering insights into their relative performance expectations and market positioning.
- Analysts currently favor an Buy trajectory for Sphere Entertainment, with an average 1-year price target of $65.83, suggesting a potential 146.19% upside.
Peer Analysis Summary
The peer analysis summary provides a snapshot of key metrics for and Sphere Entertainment, illuminating their respective standings within the industry. These metrics offer valuable insights into their market positions and comparative performance.
| Company |
Consensus |
Revenue Growth |
Gross Profit |
Return on Equity |
| Cinemark Holdings |
Outperform |
28.10% |
$596.60M |
13.76% |
| Sphere Entertainment |
Buy |
3.40% |
$151.36M |
6.81% |
Key Takeaway:
Cinemark Holdings outperforms its peers in revenue growth and gross profit, ranking at the top for both metrics. However, it lags behind in return on equity, placing in the middle compared to its peers.
About Cinemark Hldgs
Cinemark Holdings Inc is a geographically diverse operator in the motion picture exhibition industry in the United States. The company generates revenue from filmed entertainment box office receipts and concession sales, with additional revenue from screen advertising, screen rentals, and other revenue streams, such as transactional fees, vendor marketing promotions, studio trailer placements, meeting rentals, and electronic video games located in some of the theatres.
Cinemark Hldgs: A Financial Overview
Market Capitalization Analysis: Reflecting a smaller scale, the company's market capitalization is positioned below industry averages. This could be attributed to factors such as growth expectations or operational capacity.
Positive Revenue Trend: Examining Cinemark Hldgs's financials over 3 months reveals a positive narrative. The company achieved a noteworthy revenue growth rate of 28.1% as of 30 June, 2025, showcasing a substantial increase in top-line earnings. When compared to others in the Communication Services sector, the company excelled with a growth rate higher than the average among peers.
Net Margin: Cinemark Hldgs's net margin is below industry standards, pointing towards difficulties in achieving strong profitability. With a net margin of 9.81%, the company may encounter challenges in effective cost control.
Return on Equity (ROE): Cinemark Hldgs's ROE stands out, surpassing industry averages. With an impressive ROE of 13.76%, the company demonstrates effective use of equity capital and strong financial performance.
Return on Assets (ROA): Cinemark Hldgs's ROA stands out, surpassing industry averages. With an impressive ROA of 1.91%, the company demonstrates effective utilization of assets and strong financial performance.
Debt Management: The company faces challenges in debt management with a debt-to-equity ratio higher than the industry average. With a ratio of 3.02, caution is advised due to increased financial risk.
To track all earnings releases for Cinemark Hldgs visit their earnings calendar on our site.
This article was generated by Benzinga's automated content engine and reviewed by an editor.
Posted In: CNK