Earnings Preview: Iris Energy
Author: Benzinga Insights | November 05, 2025 09:02am
Iris Energy (NASDAQ:IREN) is set to give its latest quarterly earnings report on Thursday, 2025-11-06. Here's what investors need to know before the announcement.
Analysts estimate that Iris Energy will report an earnings per share (EPS) of $0.15.
The announcement from Iris Energy is eagerly anticipated, with investors seeking news of surpassing estimates and favorable guidance for the next quarter.
It's worth noting for new investors that guidance can be a key determinant of stock price movements.
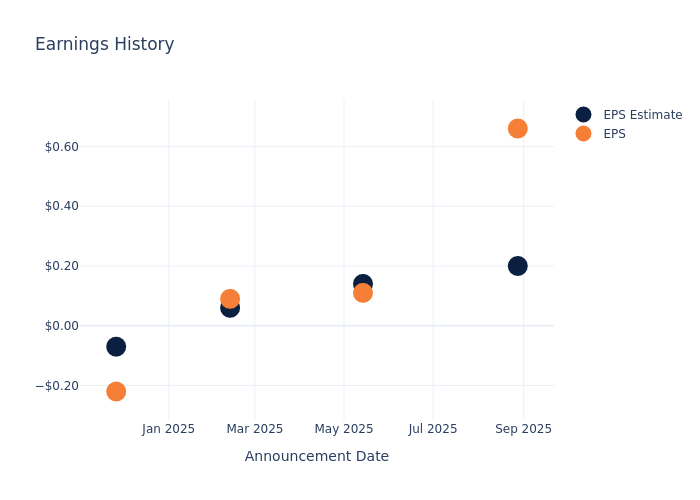
Historical Earnings Performance
The company's EPS beat by $0.46 in the last quarter, leading to a 14.93% increase in the share price on the following day.
Here's a look at Iris Energy's past performance and the resulting price change:
| Quarter |
Q4 2025 |
Q3 2025 |
Q2 2025 |
Q1 2025 |
| EPS Estimate |
0.20 |
0.14 |
0.06 |
-0.07 |
| EPS Actual |
0.66 |
0.11 |
0.09 |
-0.22 |
| Price Change % |
15.00 |
-3.00 |
1.00 |
30.00 |
Stock Performance
Shares of Iris Energy were trading at $66.63 as of November 04. Over the last 52-week period, shares are up 494.38%. Given that these returns are generally positive, long-term shareholders are likely bullish going into this earnings release.
Analyst Insights on Iris Energy
For investors, grasping market sentiments and expectations in the industry is vital. This analysis explores the latest insights regarding Iris Energy.
The consensus rating for Iris Energy is Buy, based on 16 analyst ratings. With an average one-year price target of $58.56, there's a potential 12.11% downside.
Comparing Ratings Among Industry Peers
The analysis below examines the analyst ratings and average 1-year price targets of Guidewire Software, Tyler Technologies and Samsara, three significant industry players, providing valuable insights into their relative performance expectations and market positioning.
- Analysts currently favor an Outperform trajectory for Guidewire Software, with an average 1-year price target of $284.44, suggesting a potential 326.89% upside.
- Analysts currently favor an Neutral trajectory for Tyler Technologies, with an average 1-year price target of $558.33, suggesting a potential 737.96% upside.
- Analysts currently favor an Outperform trajectory for Samsara, with an average 1-year price target of $45.38, suggesting a potential 31.89% downside.
Snapshot: Peer Analysis
In the peer analysis summary, key metrics for Guidewire Software, Tyler Technologies and Samsara are highlighted, providing an understanding of their respective standings within the industry and offering insights into their market positions and comparative performance.
| Company |
Consensus |
Revenue Growth |
Gross Profit |
Return on Equity |
| IREN |
Buy |
229.75% |
$50.47M |
5.89% |
| Guidewire Software |
Outperform |
22.32% |
$231.81M |
3.68% |
| Tyler Technologies |
Neutral |
9.67% |
$281.45M |
2.33% |
| Samsara |
Outperform |
30.41% |
$300.98M |
-1.43% |
Key Takeaway:
Iris Energy ranks at the top for Revenue Growth and Gross Profit among its peers. However, it ranks at the bottom for Return on Equity. Overall, Iris Energy is positioned favorably compared to its peers in terms of financial performance metrics.
Discovering Iris Energy: A Closer Look
IREN Ltd is engaged in data center business powering the future of Bitcoin, AI and beyond utilizing renewable energy. Bitcoin mining operations generate revenue by earning Bitcoin through a combination of Block rewards and transaction fees from the operation of its Bitcoin miners and exchanging these Bitcoin for fiat currencies such as USD or CAD.
Iris Energy's Financial Performance
Market Capitalization Analysis: Falling below industry benchmarks, the company's market capitalization reflects a reduced size compared to peers. This positioning may be influenced by factors such as growth expectations or operational capacity.
Positive Revenue Trend: Examining Iris Energy's financials over 3 months reveals a positive narrative. The company achieved a noteworthy revenue growth rate of 229.75% as of 30 June, 2025, showcasing a substantial increase in top-line earnings. As compared to its peers, the company achieved a growth rate higher than the average among peers in Information Technology sector.
Net Margin: Iris Energy's net margin is below industry averages, indicating potential challenges in maintaining strong profitability. With a net margin of 51.01%, the company may face hurdles in effective cost management.
Return on Equity (ROE): Iris Energy's financial strength is reflected in its exceptional ROE, which exceeds industry averages. With a remarkable ROE of 5.89%, the company showcases efficient use of equity capital and strong financial health.
Return on Assets (ROA): Iris Energy's ROA excels beyond industry benchmarks, reaching 3.88%. This signifies efficient management of assets and strong financial health.
Debt Management: The company faces challenges in debt management with a debt-to-equity ratio higher than the industry average. With a ratio of 0.53, caution is advised due to increased financial risk.
To track all earnings releases for Iris Energy visit their earnings calendar on our site.
This article was generated by Benzinga's automated content engine and reviewed by an editor.
Posted In: IREN


