Peter Schiff Says Bitcoin's Crashing — This Chart Says 'Not So Fast'
Author: Surbhi Jain | November 05, 2025 11:32am
Peter Schiff is calling doom again — but Bitcoin's (CRYPTO: BTC) chart might be setting up the comeback he didn't see coming. The world's largest cryptocurrency just slipped below $100,000, triggering a wave of panic selling and Schiff's predictable "told-you-so" tweets, yet one technical level suggests this drop could be the start of another leg higher.
Bitcoin Bears Have The Mic
Bitcoin's fall has been sharp — down nearly 17% this month and 20% off its October highs north of $126,000. Schiff wasted no time declaring that Bitcoin has "lost one-third of its value priced in gold" and is "about to surrender all of its 2025 gains." He's blaming whales, weak retail demand, and slowing ETF inflows — all fair concerns in a market gasping for liquidity amid a government shutdown.
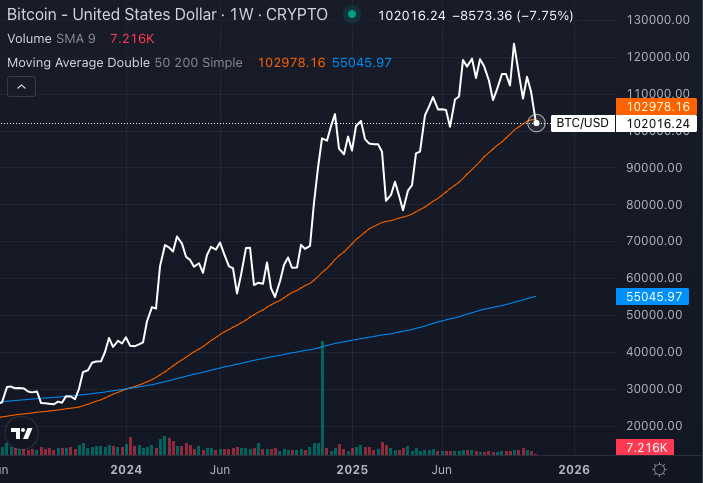
Still, the technicals tell a different story. Bitcoin is sitting right on its 50-week moving average, a line that's historically preceded massive rallies. The last two touches — September 2024 and April 2025 — saw Bitcoin surge 99% and 50%, respectively.
With BTC now hovering around $101,000, this could be another setup in disguise. Fundstrat's Sean Farrell still sees a path toward $150,000–$200,000 by year-end once liquidity tailwinds resume.
Investor Takeaway
Every cycle has its doubters, and Schiff's been calling Bitcoin's demise since before $10K. But if history's rhythm holds, the 50-week average isn't the start of a crash — it's the prelude to a breakout.
Schiff's narrative may dominate the headlines, but the chart, as always, has the last word.