Earnings Outlook For Duke Energy
Author: Benzinga Insights | November 06, 2025 09:04am
Duke Energy (NYSE:DUK) is preparing to release its quarterly earnings on Friday, 2025-11-07. Here's a brief overview of what investors should keep in mind before the announcement.
Analysts expect Duke Energy to report an earnings per share (EPS) of $1.75.
Duke Energy bulls will hope to hear the company announce they've not only beaten that estimate, but also to provide positive guidance, or forecasted growth, for the next quarter.
New investors should note that it is sometimes not an earnings beat or miss that most affects the price of a stock, but the guidance (or forecast).
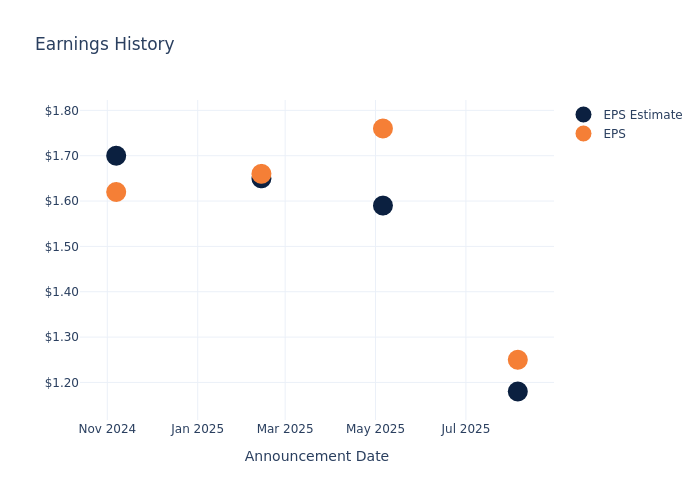
Earnings Track Record
In the previous earnings release, the company beat EPS by $0.07, leading to a 0.98% increase in the share price the following trading session.
Here's a look at Duke Energy's past performance and the resulting price change:
| Quarter |
Q2 2025 |
Q1 2025 |
Q4 2024 |
Q3 2024 |
| EPS Estimate |
1.18 |
1.59 |
1.65 |
1.70 |
| EPS Actual |
1.25 |
1.76 |
1.66 |
1.62 |
| Price Change % |
1.00 |
0.00 |
-1.00 |
2.00 |
Performance of Duke Energy Shares
Shares of Duke Energy were trading at $123.77 as of November 05. Over the last 52-week period, shares are up 9.31%. Given that these returns are generally positive, long-term shareholders are likely bullish going into this earnings release.
Analysts' Perspectives on Duke Energy
Understanding market sentiments and expectations within the industry is crucial for investors. This analysis delves into the latest insights on Duke Energy.
Duke Energy has received a total of 13 ratings from analysts, with the consensus rating as Neutral. With an average one-year price target of $135.0, the consensus suggests a potential 9.07% upside.
Peer Ratings Comparison
In this analysis, we delve into the analyst ratings and average 1-year price targets of Southern, Constellation Energy and American Electric Power, three key industry players, offering insights into their relative performance expectations and market positioning.
- Analysts currently favor an Neutral trajectory for Southern, with an average 1-year price target of $99.14, suggesting a potential 19.9% downside.
- Analysts currently favor an Outperform trajectory for Constellation Energy, with an average 1-year price target of $404.64, suggesting a potential 226.93% upside.
- Analysts currently favor an Neutral trajectory for American Electric Power, with an average 1-year price target of $125.18, suggesting a potential 1.14% upside.
Peer Metrics Summary
The peer analysis summary outlines pivotal metrics for Southern, Constellation Energy and American Electric Power, demonstrating their respective standings within the industry and offering valuable insights into their market positions and comparative performance.
| Company |
Consensus |
Revenue Growth |
Gross Profit |
Return on Equity |
| Duke Energy |
Neutral |
4.68% |
$3.82B |
1.95% |
| Southern |
Neutral |
7.55% |
$4.30B |
4.96% |
| Constellation Energy |
Outperform |
11.43% |
$1.35B |
6.36% |
| American Electric Power |
Neutral |
10.89% |
$3.63B |
3.23% |
Key Takeaway:
Duke Energy ranks in the middle among its peers for revenue growth. It is at the bottom for gross profit and return on equity.
Delving into Duke Energy's Background
Duke Energy is one of the largest US utilities, with regulated utilities in the Carolinas, Indiana, Florida, Ohio, and Kentucky that deliver electricity to more than 8 million customers. Its natural gas utilities serve more than 1.6 million customers.
Duke Energy's Economic Impact: An Analysis
Market Capitalization Analysis: The company's market capitalization surpasses industry averages, showcasing a dominant size relative to peers and suggesting a strong market position.
Revenue Growth: Duke Energy displayed positive results in 3 months. As of 30 June, 2025, the company achieved a solid revenue growth rate of approximately 4.68%. This indicates a notable increase in the company's top-line earnings. As compared to competitors, the company encountered difficulties, with a growth rate lower than the average among peers in the Utilities sector.
Net Margin: The company's net margin is a standout performer, exceeding industry averages. With an impressive net margin of 12.93%, the company showcases strong profitability and effective cost control.
Return on Equity (ROE): Duke Energy's ROE is below industry standards, pointing towards difficulties in efficiently utilizing equity capital. With an ROE of 1.95%, the company may encounter challenges in delivering satisfactory returns for shareholders.
Return on Assets (ROA): Duke Energy's ROA falls below industry averages, indicating challenges in efficiently utilizing assets. With an ROA of 0.51%, the company may face hurdles in generating optimal returns from its assets.
Debt Management: Duke Energy's debt-to-equity ratio is below the industry average at 1.77, reflecting a lower dependency on debt financing and a more conservative financial approach.
To track all earnings releases for Duke Energy visit their earnings calendar on our site.
This article was generated by Benzinga's automated content engine and reviewed by an editor.
Posted In: DUK