Exploring Koppers Hldgs's Earnings Expectations
Author: Benzinga Insights | November 06, 2025 11:04am
Koppers Hldgs (NYSE:KOP) is gearing up to announce its quarterly earnings on Friday, 2025-11-07. Here's a quick overview of what investors should know before the release.
Analysts are estimating that Koppers Hldgs will report an earnings per share (EPS) of $1.21.
The announcement from Koppers Hldgs is eagerly anticipated, with investors seeking news of surpassing estimates and favorable guidance for the next quarter.
It's worth noting for new investors that guidance can be a key determinant of stock price movements.
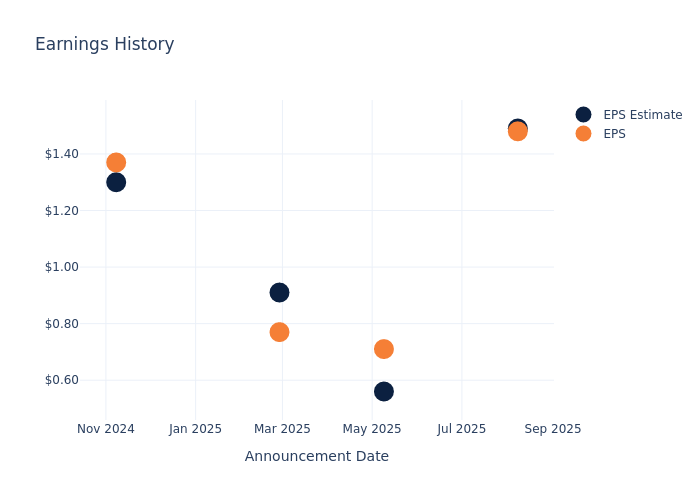
Past Earnings Performance
The company's EPS missed by $0.01 in the last quarter, leading to a 0.0% drop in the share price on the following day.
Here's a look at Koppers Hldgs's past performance and the resulting price change:
| Quarter |
Q2 2025 |
Q1 2025 |
Q4 2024 |
Q3 2024 |
| EPS Estimate |
1.49 |
0.56 |
0.91 |
1.30 |
| EPS Actual |
1.48 |
0.71 |
0.77 |
1.37 |
| Price Change % |
-13.00 |
3.00 |
0.00 |
-2.00 |
Market Performance of Koppers Hldgs's Stock
Shares of Koppers Hldgs were trading at $28.05 as of November 05. Over the last 52-week period, shares are down 24.7%. Given that these returns are generally negative, long-term shareholders are likely bearish going into this earnings release.
Insights Shared by Analysts on Koppers Hldgs
Understanding market sentiments and expectations within the industry is crucial for investors. This analysis delves into the latest insights on Koppers Hldgs.
A total of 3 analyst ratings have been received for Koppers Hldgs, with the consensus rating being Outperform. The average one-year price target stands at $53.33, suggesting a potential 90.12% upside.
Peer Ratings Overview
The analysis below examines the analyst ratings and average 1-year price targets of Kronos Worldwide, Tronox Holdings and Orion, three significant industry players, providing valuable insights into their relative performance expectations and market positioning.
- Analysts currently favor an Sell trajectory for Kronos Worldwide, with an average 1-year price target of $6.0, suggesting a potential 78.61% downside.
- Analysts currently favor an Buy trajectory for Tronox Holdings, with an average 1-year price target of $4.48, suggesting a potential 84.03% downside.
- Analysts currently favor an Underperform trajectory for Orion, with an average 1-year price target of $9.25, suggesting a potential 67.02% downside.
Analysis Summary for Peers
The peer analysis summary provides a snapshot of key metrics for Kronos Worldwide, Tronox Holdings and Orion, illuminating their respective standings within the industry. These metrics offer valuable insights into their market positions and comparative performance.
| Company |
Consensus |
Revenue Growth |
Gross Profit |
Return on Equity |
| Koppers Holdings |
Outperform |
-10.37% |
$114.20M |
3.20% |
| Kronos Worldwide |
Sell |
-1.22% |
$62.80M |
-1.09% |
| Tronox Holdings |
Buy |
-10.85% |
$79M |
-5.06% |
| Orion |
Underperform |
-2.70% |
$85.60M |
-15.46% |
Key Takeaway:
Koppers Holdings has the highest gross profit among its peers. It ranks second in terms of consensus rating. The company's revenue growth is the lowest compared to its peers. Koppers Holdings has the highest return on equity.
About Koppers Hldgs
Koppers Holdings Inc through its subsidiaries, manufactures and sells wood products, wood treatment chemicals, and carbon compounds used in markets such as railroad, aluminum and steel, agriculture, utilities, and residential lumber. The company is organized into three business segments: railroad and utility products and services, performance chemicals, and carbon materials and chemicals. Its product portfolio includes treated and untreated wood products like crossties used in railroads, wood preservation chemicals, and carbon compounds such as creosote used in the treatment of wood crossties, among others. The majority of its revenue comes from the company's railroad and utility products and services segment, and more than half of the company's revenue is earned in the United States.
Understanding the Numbers: Koppers Hldgs's Finances
Market Capitalization Analysis: Positioned below industry benchmarks, the company's market capitalization faces constraints in size. This could be influenced by factors such as growth expectations or operational capacity.
Revenue Challenges: Koppers Hldgs's revenue growth over 3 months faced difficulties. As of 30 June, 2025, the company experienced a decline of approximately -10.37%. This indicates a decrease in top-line earnings. When compared to others in the Materials sector, the company faces challenges, achieving a growth rate lower than the average among peers.
Net Margin: Koppers Hldgs's net margin excels beyond industry benchmarks, reaching 3.25%. This signifies efficient cost management and strong financial health.
Return on Equity (ROE): Koppers Hldgs's ROE surpasses industry standards, highlighting the company's exceptional financial performance. With an impressive 3.2% ROE, the company effectively utilizes shareholder equity capital.
Return on Assets (ROA): Koppers Hldgs's ROA excels beyond industry benchmarks, reaching 0.86%. This signifies efficient management of assets and strong financial health.
Debt Management: Koppers Hldgs's debt-to-equity ratio surpasses industry norms, standing at 2.03. This suggests the company carries a substantial amount of debt, posing potential financial challenges.
To track all earnings releases for Koppers Hldgs visit their earnings calendar on our site.
This article was generated by Benzinga's automated content engine and reviewed by an editor.
Posted In: KOP


