Comparative Study: Meta Platforms And Industry Competitors In Interactive Media & Services Industry
Author: Benzinga Insights | November 07, 2025 10:00am
In today's rapidly changing and highly competitive business world, it is imperative for investors and industry observers to carefully assess companies before making investment choices. In this article, we will undertake a comprehensive industry comparison, evaluating Meta Platforms (NASDAQ:META) vis-à-vis its key competitors in the Interactive Media & Services industry. Through a detailed analysis of important financial indicators, market standing, and growth potential, our goal is to provide valuable insights and highlight company's performance in the industry.
Meta Platforms Background
Meta is the largest social media company in the world, boasting close to 4 billion monthly active users worldwide. The firm's "Family of Apps," its core business, consists of Facebook, Instagram, Messenger, and WhatsApp. End users can leverage these applications for a variety of different purposes, from keeping in touch with friends to following celebrities and running digital businesses for free. Meta packages customer data, gleaned from its application ecosystem and sells ads to digital advertisers. While the firm has been investing heavily in its Reality Labs business, it remains a very small part of Meta's overall sales.
| Company |
P/E |
P/B |
P/S |
ROE |
EBITDA (in billions) |
Gross Profit (in billions) |
Revenue Growth |
| Meta Platforms Inc |
27.39 |
8.04 |
8.45 |
1.39% |
$26.85 |
$42.04 |
26.25% |
| Alphabet Inc |
28.11 |
8.88 |
9.06 |
9.33% |
$49.74 |
$60.98 |
15.95% |
| Baidu Inc |
11.62 |
1.13 |
2.36 |
2.69% |
$8.84 |
$14.36 |
-3.59% |
| Reddit Inc |
84.63 |
13.33 |
18.87 |
6.51% |
$0.14 |
$0.53 |
67.91% |
| Pinterest Inc |
9.22 |
3.68 |
4.47 |
1.91% |
$0.07 |
$0.84 |
16.79% |
| Bilibili Inc |
382.46 |
5.92 |
2.93 |
1.53% |
$0.81 |
$2.68 |
19.76% |
| Trump Media & Technology Group Corp |
148.11 |
1.63 |
791.22 |
-1.26% |
$-0.01 |
$0.0 |
5.54% |
| ZoomInfo Technologies Inc |
34.52 |
2.18 |
2.87 |
2.51% |
$0.09 |
$0.27 |
4.74% |
| CarGurus Inc |
26.51 |
7.55 |
3.78 |
5.34% |
$0.06 |
$0.2 |
7.01% |
| Weibo Corp |
7.51 |
0.72 |
1.60 |
3.58% |
$0.15 |
$0.34 |
1.58% |
| Yelp Inc |
14.74 |
2.71 |
1.51 |
5.98% |
$0.07 |
$0.33 |
3.75% |
| Tripadvisor Inc |
25.72 |
2.53 |
1.12 |
5.67% |
$0.09 |
$0.49 |
6.44% |
| Ziff Davis Inc |
20.69 |
0.73 |
0.96 |
1.44% |
$0.09 |
$0.3 |
9.79% |
| FuboTV Inc |
11.78 |
3.21 |
0.90 |
-4.64% |
$-0.01 |
$0.08 |
-2.33% |
| Yalla Group Ltd |
8.96 |
1.54 |
3.80 |
4.96% |
$0.03 |
$0.06 |
4.15% |
| Average |
58.18 |
3.98 |
60.39 |
3.25% |
$4.3 |
$5.82 |
11.25% |
Through a thorough examination of Meta Platforms, we can discern the following trends:
-
The stock's Price to Earnings ratio of 27.39 is lower than the industry average by 0.47x, suggesting potential value in the eyes of market participants.
-
The elevated Price to Book ratio of 8.04 relative to the industry average by 2.02x suggests company might be overvalued based on its book value.
-
With a relatively low Price to Sales ratio of 8.45, which is 0.14x the industry average, the stock might be considered undervalued based on sales performance.
-
The Return on Equity (ROE) of 1.39% is 1.86% below the industry average, suggesting potential inefficiency in utilizing equity to generate profits.
-
Compared to its industry, the company has higher Earnings Before Interest, Taxes, Depreciation, and Amortization (EBITDA) of $26.85 Billion, which is 6.24x above the industry average, indicating stronger profitability and robust cash flow generation.
-
The company has higher gross profit of $42.04 Billion, which indicates 7.22x above the industry average, indicating stronger profitability and higher earnings from its core operations.
-
The company's revenue growth of 26.25% is notably higher compared to the industry average of 11.25%, showcasing exceptional sales performance and strong demand for its products or services.
Debt To Equity Ratio
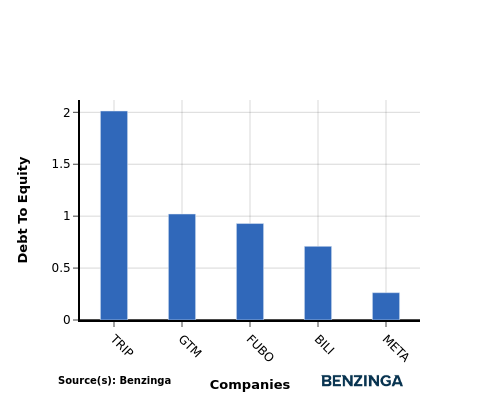
The debt-to-equity (D/E) ratio assesses the extent to which a company relies on borrowed funds compared to its equity.
Considering the debt-to-equity ratio in industry comparisons allows for a concise evaluation of a company's financial health and risk profile, aiding in informed decision-making.
By analyzing Meta Platforms in relation to its top 4 peers based on the Debt-to-Equity ratio, the following insights can be derived:
-
In terms of the debt-to-equity ratio, Meta Platforms has a lower level of debt compared to its top 4 peers, indicating a stronger financial position.
-
This implies that the company relies less on debt financing and has a more favorable balance between debt and equity with a lower debt-to-equity ratio of 0.26.
Key Takeaways
For Meta Platforms, the PE ratio is low compared to peers, indicating potential undervaluation. The high PB ratio suggests the market values the company's assets highly. A low PS ratio implies sales are generating strong value. The low ROE may indicate lower profitability compared to peers. The high EBITDA and gross profit highlight strong operational performance. The high revenue growth indicates potential for future expansion.
This article was generated by Benzinga's automated content engine and reviewed by an editor.
Posted In: META


