What to Expect from Plug Power's Earnings
Author: Benzinga Insights | November 07, 2025 10:04am
Plug Power (NASDAQ:PLUG) will release its quarterly earnings report on Monday, 2025-11-10. Here's a brief overview for investors ahead of the announcement.
Analysts anticipate Plug Power to report an earnings per share (EPS) of $-0.13.
Anticipation surrounds Plug Power's announcement, with investors hoping to hear about both surpassing estimates and receiving positive guidance for the next quarter.
New investors should understand that while earnings performance is important, market reactions are often driven by guidance.
Overview of Past Earnings
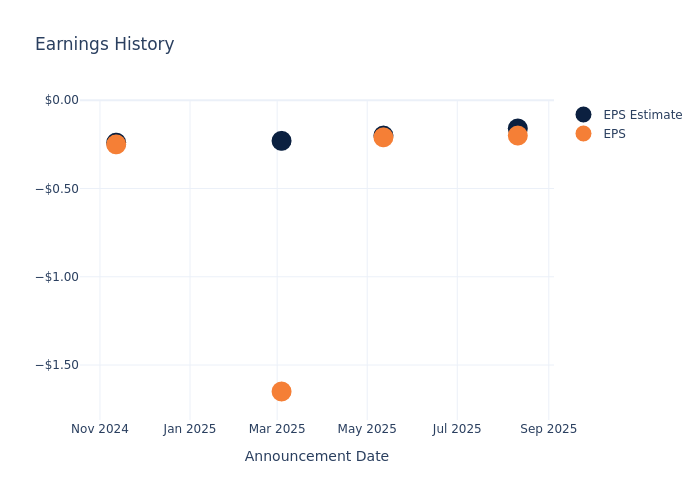
During the last quarter, the company reported an EPS missed by $0.04, leading to a 2.53% drop in the share price on the subsequent day.
Here's a look at Plug Power's past performance and the resulting price change:
| Quarter |
Q2 2025 |
Q1 2025 |
Q4 2024 |
Q3 2024 |
| EPS Estimate |
-0.16 |
-0.20 |
-0.23 |
-0.24 |
| EPS Actual |
-0.20 |
-0.21 |
-1.65 |
-0.25 |
| Price Change % |
-3.00 |
-10.00 |
4.00 |
3.00 |
Stock Performance
Shares of Plug Power were trading at $2.51 as of November 06. Over the last 52-week period, shares are up 19.1%. Given that these returns are generally positive, long-term shareholders are likely bullish going into this earnings release.
Analysts' Take on Plug Power
For investors, staying informed about market sentiments and expectations in the industry is paramount. This analysis provides an exploration of the latest insights on Plug Power.
Analysts have given Plug Power a total of 5 ratings, with the consensus rating being Neutral. The average one-year price target is $3.3, indicating a potential 31.47% upside.
Comparing Ratings Among Industry Peers
In this analysis, we delve into the analyst ratings and average 1-year price targets of Fluence Energy, Enovix and Vicor, three key industry players, offering insights into their relative performance expectations and market positioning.
- Analysts currently favor an Neutral trajectory for Fluence Energy, with an average 1-year price target of $11.73, suggesting a potential 367.33% upside.
- Analysts currently favor an Buy trajectory for Enovix, with an average 1-year price target of $23.0, suggesting a potential 816.33% upside.
- Analysts currently favor an Buy trajectory for Vicor, with an average 1-year price target of $90.0, suggesting a potential 3485.66% upside.
Overview of Peer Analysis
In the peer analysis summary, key metrics for Fluence Energy, Enovix and Vicor are highlighted, providing an understanding of their respective standings within the industry and offering insights into their market positions and comparative performance.
| Company |
Consensus |
Revenue Growth |
Gross Profit |
Return on Equity |
| Plug Power |
Neutral |
21.36% |
$-53.47M |
-12.84% |
| Fluence Energy |
Neutral |
24.67% |
$89.10M |
1.57% |
| Enovix |
Buy |
85.08% |
$1.40M |
-21.57% |
| Vicor |
Buy |
18.52% |
$63.51M |
4.57% |
Key Takeaway:
Plug Power is positioned in the middle among its peers for consensus rating. It ranks at the bottom for revenue growth and gross profit, while it is at the top for return on equity.
About Plug Power
Plug Power is building an end-to-end green hydrogen ecosystem—from production, storage, and delivery to energy generation. The company plans to build and operate green hydrogen highways across North America and Europe. Plug will deliver its green hydrogen solutions directly to its customers and through joint venture partners into multiple end markets, including material handling, e-mobility, power generation, and industrial applications.
Financial Milestones: Plug Power's Journey
Market Capitalization: Indicating a reduced size compared to industry averages, the company's market capitalization poses unique challenges.
Revenue Growth: Over the 3 months period, Plug Power showcased positive performance, achieving a revenue growth rate of 21.36% as of 30 June, 2025. This reflects a substantial increase in the company's top-line earnings. When compared to others in the Industrials sector, the company faces challenges, achieving a growth rate lower than the average among peers.
Net Margin: Plug Power's net margin is below industry averages, indicating potential challenges in maintaining strong profitability. With a net margin of -130.54%, the company may face hurdles in effective cost management.
Return on Equity (ROE): Plug Power's ROE lags behind industry averages, suggesting challenges in maximizing returns on equity capital. With an ROE of -12.84%, the company may face hurdles in achieving optimal financial performance.
Return on Assets (ROA): Plug Power's ROA is below industry averages, indicating potential challenges in efficiently utilizing assets. With an ROA of -6.5%, the company may face hurdles in achieving optimal financial returns.
Debt Management: Plug Power's debt-to-equity ratio is below the industry average at 0.59, reflecting a lower dependency on debt financing and a more conservative financial approach.
To track all earnings releases for Plug Power visit their earnings calendar on our site.
This article was generated by Benzinga's automated content engine and reviewed by an editor.
Posted In: PLUG