Insights into PowerFleet's Upcoming Earnings
Author: Benzinga Insights | November 07, 2025 11:04am
PowerFleet (NASDAQ:AIOT) is gearing up to announce its quarterly earnings on Monday, 2025-11-10. Here's a quick overview of what investors should know before the release.
Analysts are estimating that PowerFleet will report an earnings per share (EPS) of $0.07.
PowerFleet bulls will hope to hear the company announce they've not only beaten that estimate, but also to provide positive guidance, or forecasted growth, for the next quarter.
New investors should note that it is sometimes not an earnings beat or miss that most affects the price of a stock, but the guidance (or forecast).
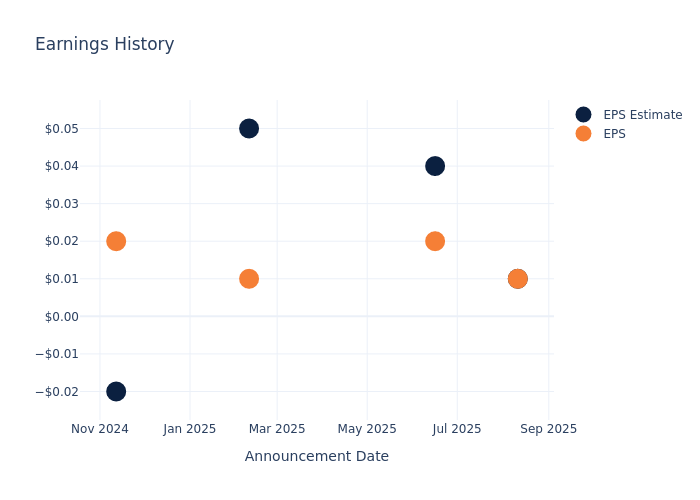
Earnings Track Record
Last quarter the company missed EPS by $0.00, which was followed by a 5.92% increase in the share price the next day.
Here's a look at PowerFleet's past performance and the resulting price change:
| Quarter |
Q1 2025 |
Q4 2024 |
Q3 2024 |
Q2 2024 |
| EPS Estimate |
0.01 |
0.04 |
0.05 |
-0.02 |
| EPS Actual |
0.01 |
0.02 |
0.01 |
0.02 |
| Price Change % |
6.00 |
-6.00 |
9.00 |
20.00 |
Market Performance of PowerFleet's Stock
Shares of PowerFleet were trading at $4.78 as of November 06. Over the last 52-week period, shares are down 13.48%. Given that these returns are generally negative, long-term shareholders are likely upset going into this earnings release.
Analysts' Perspectives on PowerFleet
For investors, staying informed about market sentiments and expectations in the industry is paramount. This analysis provides an exploration of the latest insights on PowerFleet.
Analysts have given PowerFleet a total of 4 ratings, with the consensus rating being Outperform. The average one-year price target is $15.0, indicating a potential 213.81% upside.
Peer Ratings Comparison
The analysis below examines the analyst ratings and average 1-year price targets of Evolv Technologies, Ouster and Nayax, three significant industry players, providing valuable insights into their relative performance expectations and market positioning.
- Analysts currently favor an Buy trajectory for Evolv Technologies, with an average 1-year price target of $9.33, suggesting a potential 95.19% upside.
- Analysts currently favor an Buy trajectory for Ouster, with an average 1-year price target of $46.67, suggesting a potential 876.36% upside.
- Analysts currently favor an Neutral trajectory for Nayax, with an average 1-year price target of $43.0, suggesting a potential 799.58% upside.
Peer Metrics Summary
Within the peer analysis summary, vital metrics for Evolv Technologies, Ouster and Nayax are presented, shedding light on their respective standings within the industry and offering valuable insights into their market positions and comparative performance.
| Company |
Consensus |
Revenue Growth |
Gross Profit |
Return on Equity |
| PowerFleet |
Outperform |
38.04% |
$56.48M |
-2.26% |
| Evolv Technologies |
Buy |
29.02% |
$16.22M |
-37.93% |
| Ouster |
Buy |
12.77% |
$15.84M |
-9.28% |
| Nayax |
Neutral |
22.41% |
$46.17M |
6.10% |
Key Takeaway:
PowerFleet ranks first in revenue growth among its peers. It ranks last in gross profit margin. It has the lowest return on equity. Overall, PowerFleet is positioned in the middle compared to its peers.
All You Need to Know About PowerFleet
PowerFleet Inc is engaged in Internet-of-Things (IoT) solutions providing valuable business intelligence for managing high-value enterprise assets that improve operational efficiencies. It provide critical information that powers unified operations throughout organizations. It is solving the challenge of inefficient data collection, real-time visibility, and analysis that leads to transformative business operations. Its SaaS cloud-based applications take data from IoT devices and ecosystem of third-party and partner applications to present actionable information for customer.
Unraveling the Financial Story of PowerFleet
Market Capitalization Perspectives: The company's market capitalization falls below industry averages, signaling a relatively smaller size compared to peers. This positioning may be influenced by factors such as perceived growth potential or operational scale.
Revenue Growth: Over the 3 months period, PowerFleet showcased positive performance, achieving a revenue growth rate of 38.04% as of 30 June, 2025. This reflects a substantial increase in the company's top-line earnings. As compared to its peers, the company achieved a growth rate higher than the average among peers in Information Technology sector.
Net Margin: PowerFleet's net margin is below industry averages, indicating potential challenges in maintaining strong profitability. With a net margin of -9.83%, the company may face hurdles in effective cost management.
Return on Equity (ROE): PowerFleet's ROE is below industry standards, pointing towards difficulties in efficiently utilizing equity capital. With an ROE of -2.26%, the company may encounter challenges in delivering satisfactory returns for shareholders.
Return on Assets (ROA): The company's ROA is below industry benchmarks, signaling potential difficulties in efficiently utilizing assets. With an ROA of -1.11%, the company may need to address challenges in generating satisfactory returns from its assets.
Debt Management: PowerFleet's debt-to-equity ratio stands notably higher than the industry average, reaching 0.61. This indicates a heavier reliance on borrowed funds, raising concerns about financial leverage.
To track all earnings releases for PowerFleet visit their earnings calendar on our site.
This article was generated by Benzinga's automated content engine and reviewed by an editor.
Posted In: AIOT


