The Insider Report: The Bears Have Been Poked – Will They Fall Back Asleep?
Author: Gianni di Poce | November 10, 2025 07:46am
Market Overview
Stocks dropped hard last week, but a late-day rally on Friday staved off the worst. The Dow Jones Industrial Average held up the best, only closing down 1.21%. The S&P 500 was down 1.63%, but the Nasdaq suffered the most, as it closed down 3.04%. Tech was routed hard as a massive rotation took place. Healthcare is still holding up nicely, and I'm watching for confirmation that crypto has bottomed here too.
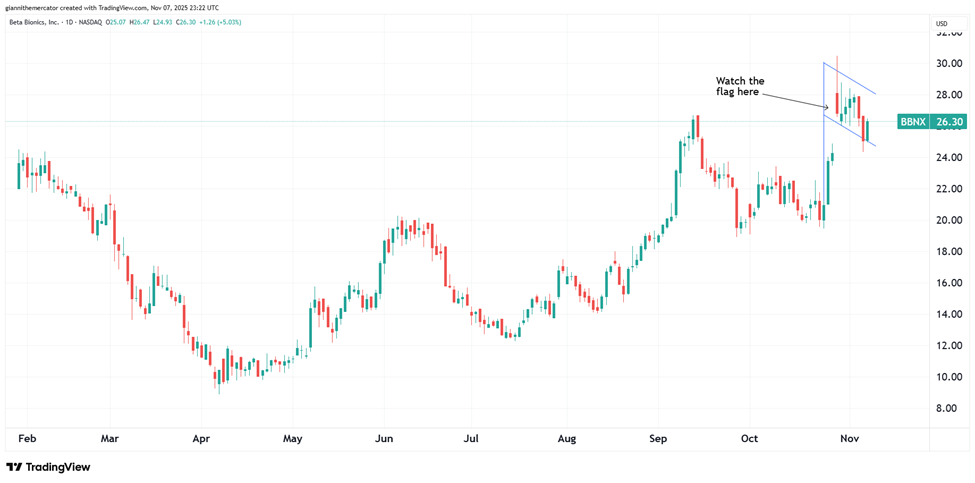
Beta Bionics, Inc. (BBNX) is a leading commercial-stage medical device company developing innovative bionic pancreas systems for automated insulin delivery in people with diabetes, offering investors exposure to the rapidly growing diabetes management and medical technology sector with a focus on adaptive algorithms and simplified therapy solutions.
The previous quarter showed revenue of $27.25 million, but a loss of $14.21 million.
This valuation on BBNX is elevated. Price-to-Sales is at 13.76 and Book Value is 6.70.
From a technical standpoint, BBNX is flagging within a bull flag formation. These are some of the most powerful chart patterns out there.
Why It's Happening
Beta Bionics Inc. is transforming diabetes management with its groundbreaking iLet Bionic Pancreas system, delivering automated insulin dosing initialized solely by a user’s body weight to eliminate carb counting and manual adjustments. This user-friendly innovation has driven explosive adoption, with the installed customer base surging 162% to 29,419 users in Q3 2025, positioning Beta Bionics as a leader in simplifying life for over 1.3 million U.S. insulin-dependent patients and tapping into a multi-billion-dollar market ripe for penetration.
Robust revenue acceleration fuels Beta Bionics’ growth narrative, with Q3 2025 sales reaching $27.25 million—a 14% beat on estimates—powered by record new patient starts and a pharmacy channel mix climbing to the low 30s percentage. The company’s upward revision to $96.5 million for full-year 2025 guidance reflects strong manufacturing scale and channel expansion, creating a flywheel of recurring revenue from supplies that sustains long-term profitability in the automated insulin delivery space.
Strategic partnerships with industry giants like Abbott enhance Beta Bionics’ ecosystem dominance. The agreement to integrate iLet with Abbott’s upcoming dual glucose-ketone sensor builds on existing compatibility with FreeStyle Libre 3 Plus, advancing fully automated care for type 1 and off-label type 2 patients while broadening access through seamless tech interoperability and reinforcing its role as an innovator in collaborative diabetes solutions.
Pipeline advancements in bihormonal therapy unlock transformative potential for diabetes treatment. Completion of the glucagon pharmacokinetic trial in Canada in September 2025 bridges prior clinical data, paving the way for a feasibility trial of the bihormonal iLet system in New Zealand this quarter—offering a holistic insulin-and-glucagon delivery approach that could redefine outcomes for millions, extending Beta Bionics’ leadership into next-generation therapies.
Analyst Ratings:
Goldman Sachs: Buy
Stifel: Buy
Truist Securities: Buy
My Action Plan (60% Return Potential)
I am bullish on BBNX above $23.00-$23.50. My upside target is $42.00-$44.00.
Applied Digital Corporation (Ticker: APLD) – 61% Return Potential
What's Happening
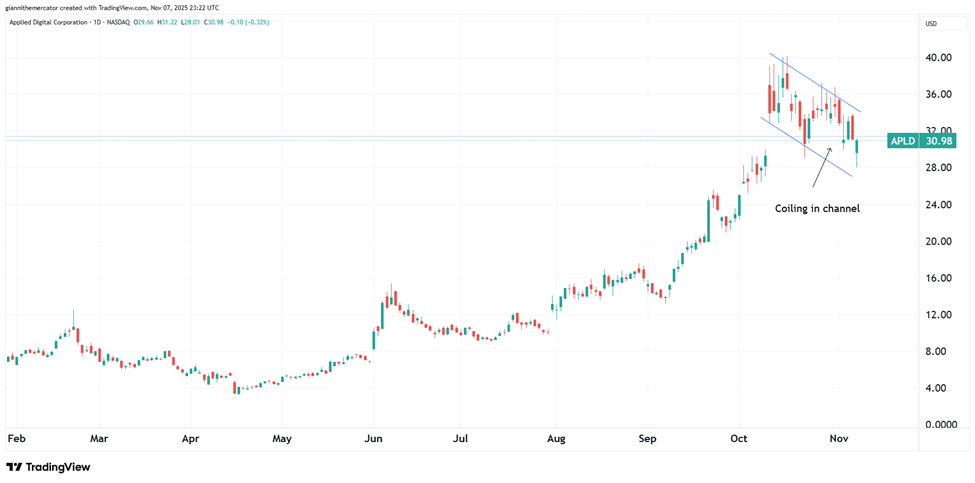
Applied Digital Corporation (APLD) is a leading provider of digital infrastructure solutions for high-performance computing (HPC) and artificial intelligence applications, designing and operating data centers that support GPU computing for AI, machine learning, and cryptocurrency mining, offering investors exposure to the rapidly growing AI infrastructure and digital asset sectors with a focus on scalable, power-efficient facilities.
The most recent quarterly report had revenue of $64.22 million, but a loss of $7.57 million.
Valuation is up in the clouds for this one. Price-to-Sales is 43.16 and Book Value is 3.73.
From a technical point of view, APLD is correcting within a descending channel. If it breaks above the upper trendline of the pattern, look for this to explode to new all-time highs again.
Why It's Happening
Applied Digital Corporation is at the epicenter of the AI infrastructure boom, securing a landmark $5 billion, 15-year lease agreement with a leading U.S. hyperscaler for 200 MW of capacity at its Polaris Forge 2 campus in North Dakota. This transformative deal, announced in October 2025, catapults Applied Digital into the ranks of elite data center providers, unlocking massive revenue potential as hyperscaler spending surges past $350 billion this year amid unrelenting demand for AI compute power.
Strategic expansion of HPC facilities positions Applied Digital for explosive scalability. Achieving Ready for Service for Phase 1 (50 MW) at Polaris Forge Building 1 in late October 2025, with full 100 MW online by Q4 and additional 150 MW phases slated for 2026 and 2027, the company is rapidly building a 1 GW powerhouse tailored for AI and high-performance computing workloads—capitalizing on the sector’s 25.6% annual growth through 2034.
Pivotal partnership with CoreWeave amplifies Applied Digital’s growth trajectory. The expanded collaboration, including a multi-year hosting agreement for advanced AI infrastructure, leverages CoreWeave’s GPU expertise to drive utilization and revenue, reinforcing the narrative of Applied Digital as a preferred partner for next-generation cloud providers in the $23 billion Neo Cloud market exploding at a 69% CAGR through 2030.
Robust financing firepower ensures seamless execution of ambitious plans. The $5 billion perpetual preferred equity facility with Macquarie Asset Management, finalized in early 2025, provides non-dilutive capital to fuel data center buildouts and energy-efficient innovations, creating a war chest that de-risks growth and attracts institutional interest in this high-margin AI enabler.
Analyst Ratings:
Needham: Buy
Craig-Hallum: Buy
Lake Street: Buy
My Action Plan (61% Return Potential)
I am bullish on APLD above $27.00-$28.00. My upside target is $50.00-$52.00.
Eos Energy Enterprises (Ticker: EOSE) – 96% Return Potential
What's Happening
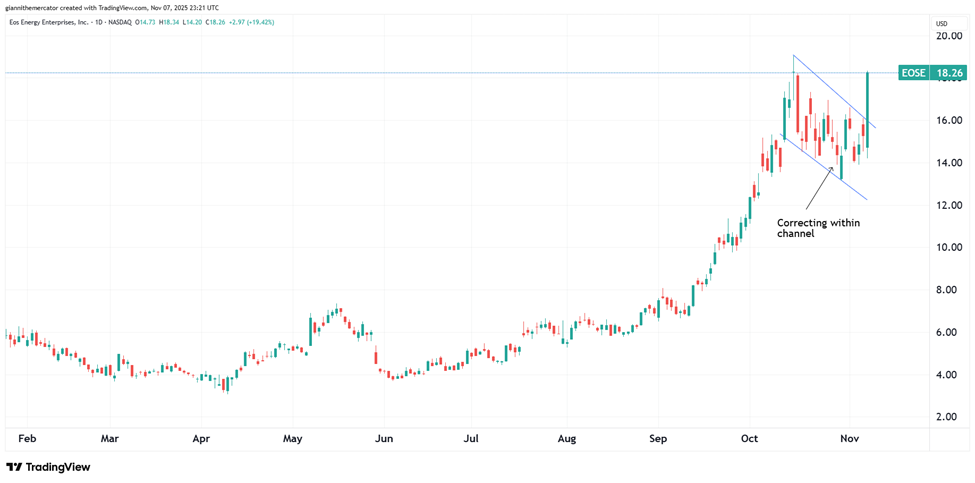
Eos Energy Enterprises, Inc. (EOSE) is a leading innovator in zinc-based energy storage solutions, designing, manufacturing, and deploying long-duration battery systems for utility-scale, commercial, industrial, and microgrid applications, offering investors exposure to the rapidly growing renewable energy and grid storage sector with a focus on sustainable, cost-effective alternatives to lithium-ion batteries.
The company showed revenue of $15.24 million in the last quarter, but a loss of $87.05 million.
Valuation in EOSE is very high. Price-to-Sales is 103.79, and Book Value is actually negative at 3.95.
From a charting perspective, EOSE is breaking out from a channel as it looks to complete another higher-low with respect to the trend.
Why It's Happening
Eos Energy Enterprises Inc. is capitalizing on the explosive demand for long-duration energy storage in the AI era, securing a landmark partnership with Talen Energy to advance power capacity for AI infrastructure and a 228 MWh order from Frontier Power in October 2025. These deals highlight Eos’s zinc-based Z3™ systems as a critical enabler for hyperscalers’ energy needs, positioning the company at the intersection of clean energy and the multi-trillion-dollar data center boom.
Aggressive manufacturing expansion underscores Eos’s scalability ambitions. The launch of Project AMAZE—a 432,000-square-foot facility in Pennsylvania set to double production to 2 GWh by Q4 2025—creates 735 new jobs and leverages $22 million in state incentives, transforming Eos from an emerging player into a high-volume supplier ready to meet surging grid and renewable integration demands.
Robust commercial pipeline fuels Eos’s growth narrative. With an $18.8 billion opportunity backlog and $672.5 million in firm orders as of Q2 2025, including a 750 MWh supply agreement with MN8 Energy, the company is building a fortress of long-term contracts that provide revenue visibility and de-risk execution in the $100 billion+ energy storage market.
Technological superiority in zinc batteries differentiates Eos in a lithium-dominated landscape. Offering up to 30% lower operating costs, no thermal runaway risks, 20-year lifespan, and high-density deployment (1-3 GWh per acre), Eos’s solutions excel in multiple daily cycles and qualify for U.S. tax credits with 91% domestic content, making it a preferred choice for sustainable, resilient energy infrastructure.
Analyst Ratings:
Guggenheim: Buy
Stifel: Buy
B. Riley Securities: Neutral
My Action Plan (96% Return Potential)
I am bullish on EOSE above $12.50-$13.00. My upside target is $40.00-$42.00.
Market-Moving Catalysts for the Week Ahead
Data Dump?
There's chatter that the government is about to reopen again, as there are parts of the country whose air space could be getting shut down soon. In the meantime, markets have gone without numerous bits of economic data – for better or worse.
There is a growing sense of dread around the labor market specifically, but Fed Chair Powell hinted at another pause in rate cuts last week. Could it just be as simply as allowing the "price stability" metric of 2% annual inflation to rise to 3%?
Typically, labor market weakness leads to rate cuts. But over the past couple of weeks, there haven't been data releases due to the government shutdown. This week, we would be in store for a lot of inflation data, but we may have to deal with an even greater deluge of data at once if the government reopens here soon.
The Relationship Between Capital and Goods
There's a big case at the Supreme Court worth keeping an eye on right now, and it has to do with the legality of the tariffs imposed by the Trump administration year-to-date. If it gets overturned, we may have to deal with a pretty serious fiscal issue – how does all of this money get refunded?
The U.S. has a major trade deficit. In theory, this weakens the dollar because every time we buy a good from overseas, we have to sell dollars to buy the currency of the country we're buying from. Despite this, the dollar remains comparatively strong.
Herein lies a major problem – the U.S. can't competitively export goods because of this dollar strength. But the other problem is that other countries abroad don't have safe financial markets like we do, and so all of the big money managers park their assets in dollars. It creates a real problem that we seemingly haven't figured out yet.
Sector & Industry Strength
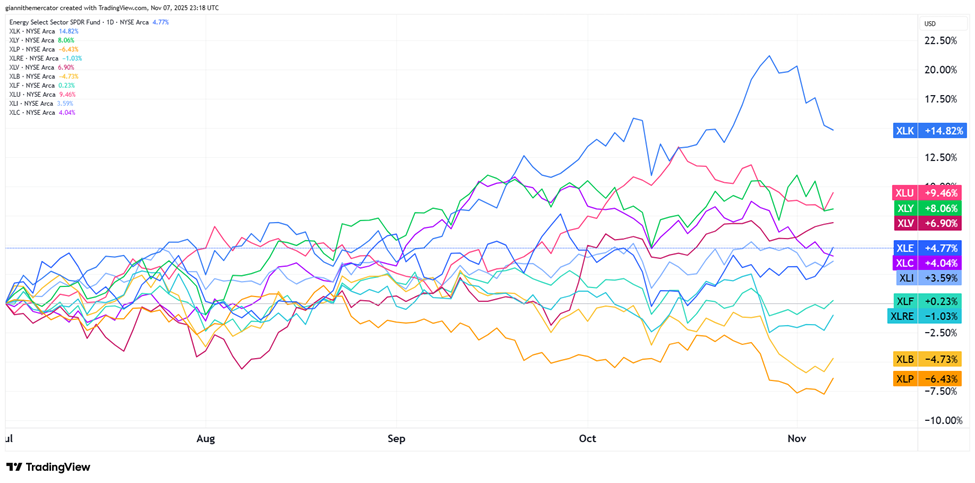
It's been a rather unusual market with respect to flows since the start of the third quarter. There are four of the eleven sectors of the S&P in negative territory since then. The only one that gives me some concern is financials (XLF).
There's been a lot of talk about weak breadth in the market. But take a look at the lagging sectors here. Aside from financials, none of these sectors are required to participate for stocks to continue higher. It's just math.
We keep seeing weakness in the defensive sectors like real estate (XLRE) and consumer staples (XLP). Tech (XLK) keeps leading. Consumer discretionary (XLY) is neck and neck with utilities (XLU), which is the only real defensive sector doing well right now.
1 week
3 Weeks
13 Weeks
26 Weeks
Energy
Energy
Healthcare
Technology
Editor's Note: Defensive rotation – let's see how long it last.
Stocks Still the Spot (Sector ETF: SPY/TLT)
It's quite remarkable how every 2% pullback from the all-time highs in stocks leads bears to take a victory lap. But the money flows are still overwhelmingly favoring stocks as an asset class in general.
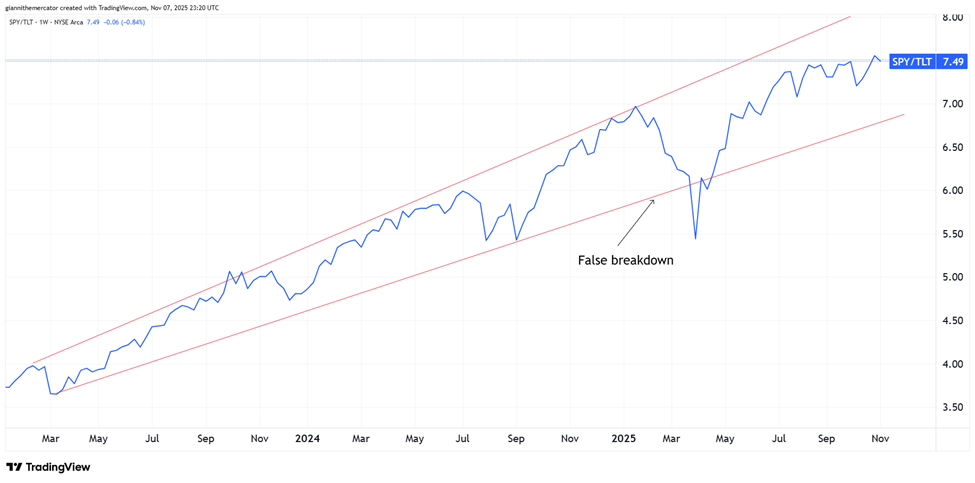
I'm looking at the ratio here between the S&P 500 (SPY) and long-term Treasuries (TLT). This is one of the most classical "risk-on" versus "risk-off" ratios out there. Simply put, when SPY outperforms TLT, it pays to take risks. When TLT outperforms SPY, it's time to be more cautious.
This ratio continues to climb higher, favoring the ownership of stocks over bonds. As long as it keeps making higher-highs and higher-lows, and it stays within the ascending channel, I expect this bull market to continue.
The Rotation of 2026? (Sector ETF: XLV/XLK)
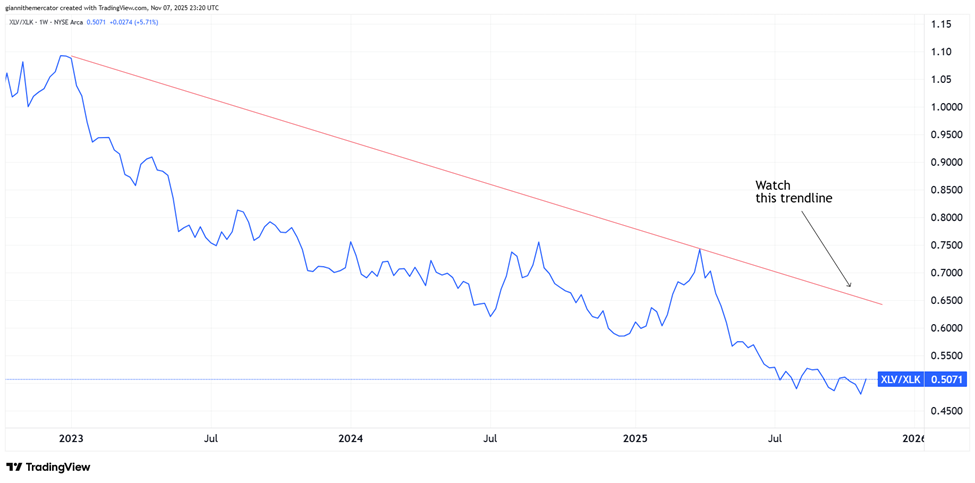
For all the attention tech gets (and rightfully so), we can't forget about the second-largest sector in the S&P 500 – healthcare. This chart looks at the ratio between healthcare (XLV) and technology (XLK).
It's no surprise to see a downtrend, and how tech has absolutely dominated healthcare over the past few years, but let's not forget that sector rotation is literally the life blood of bull markets. As a result, I'm looking for healthcare to make a comeback in 2026.
First thing's first – we need to start seeing higher-highs and higher-lows, versus lower-lows and lower-highs in this ratio. Then, I'd like to see the downward sloping trendline broken to the upside. That would be the setup for healthcare to run in 2026.
When it comes to inflation, let me start by saying that I understand the data has some serious issues. From changed formulas over the years, to creative statistical loopholes like "shrinkflation," but that's a conversation for another time.
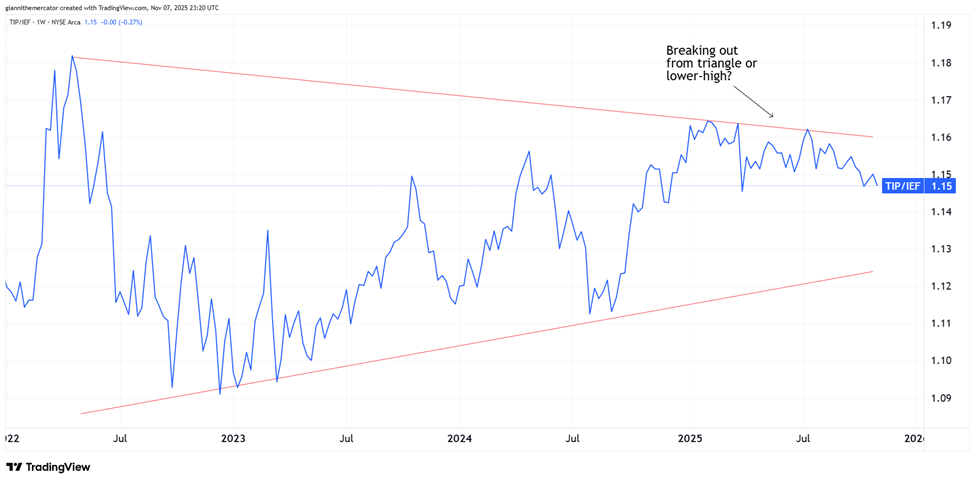
There are two things that matter when it comes to how the market is pricing inflation: 1). The performance of commodities and 2). Interest rates and money flows within the bond market. I'm looking at the ratio between Treasury Inflation Protected Securities (TIP) and 7-10 Year Treasuries (IEF).
When this ratio is rising, it means that the bond market is pricing in higher inflation. When it's falling, it means that bonds aren't concerned about inflation. Over the past couple years, the ratio has more or less been going sideways.
My Take:
It's crazy to think how inflation peaked way back in June 2022. This was actually the exact high in the ratio too. We have a symmetrical triangle formation on this chart now, which points to a continuation higher in time.
However, there's still room for this ratio to drop and stay consolidating within the pattern. Thus, I'm not expecting inflation to accelerate immediately, but I am looking for it to start accelerating sometime in 2026. This ratio will give us a good clue as to when.
Cryptocurrency
With the recent flush in crypto markets, it's a good time to have a closer look at what's going on in Ethereum. Could we be on the verge of the biggest capitulation since April? The last time, it presented one of the best buying opportunities in the entire market of the year.
Despite the sharp selloff, Ethereum remains within the descending price channel. These are continuation patterns, which means they tend to resolve in the direction of the underlying trend. The longer-term trend in Ethereum is still up, but it's been correcting for almost three months now.
It's really key that Ethereum holds support in the 3200-3300 zone. So far, so good, but bulls can't say they have the upper hand in this market unless they're able to close it back above 4,000-4,200. It's a waiting game for now.
Legal Disclosures:
This communication is provided for information purposes only.
This communication has been prepared based upon information, including market prices, data and other information, from sources believed to be reliable, but Benzinga does not warrant its completeness or accuracy except with respect to any disclosures relative to Benzinga and/or its affiliates and an analyst’s involvement with any company (or security, other financial product or other asset class) that may be the subject of this communication. Any opinions and estimates constitute our judgment as of the date of this material and are subject to change without notice. Past performance is not indicative of future results. This communication is not intended as an offer or solicitation for the purchase or sale of any financial instrument. Benzinga does not provide individually tailored investment advice. Any opinions and recommendations herein do not take into account individual client circumstances, objectives, or needs and are not intended as recommendations of particular securities, financial instruments or strategies to particular clients. You must make your own independent decisions regarding any securities, financial instruments or strategies mentioned or related to the information herein. Periodic updates may be provided on companies, issuers or industries based on specific developments or announcements, market conditions or any other publicly available information. However, Benzinga may be restricted from updating information contained in this communication for regulatory or other reasons. Clients should contact analysts and execute transactions through a Benzinga subsidiary or affiliate in their home jurisdiction unless governing law permits otherwise.
This communication may not be redistributed or retransmitted, in whole or in part, or in any form or manner, without the express written consent of Benzinga. Any unauthorized use or disclosure is prohibited. Receipt and review of this information constitutes your agreement not to redistribute or retransmit the contents and information contained in this communication without first obtaining express permission from an authorized officer of Benzinga. Copyright 2022 Benzinga. All rights reserved.