Insights Into Apple's Performance Versus Peers In Technology Hardware, Storage & Peripherals Sector
Author: Benzinga Insights | November 10, 2025 10:00am
In today's rapidly evolving and fiercely competitive business landscape, it is crucial for investors and industry analysts to conduct comprehensive company evaluations. In this article, we will undertake an in-depth industry comparison, assessing Apple (NASDAQ:AAPL) alongside its primary competitors in the Technology Hardware, Storage & Peripherals industry. By meticulously examining crucial financial indicators, market positioning, and growth potential, we aim to provide valuable insights to investors and shed light on company's performance within the industry.
Apple Background
Apple is among the largest companies in the world, with a broad portfolio of hardware and software products targeted at consumers and businesses. Apple's iPhone makes up a majority of the firm sales, and Apple's other products like Mac, iPad, and Watch are designed around the iPhone as the focal point of an expansive software ecosystem. Apple has progressively worked to add new applications, like streaming video, subscription bundles, and augmented reality. The firm designs its own software and semiconductors while working with subcontractors like Foxconn and TSMC to build its products and chips. Slightly less than half of Apple's sales come directly through its flagship stores, with a majority of sales coming indirectly through partnerships and distribution.
| Company |
P/E |
P/B |
P/S |
ROE |
EBITDA (in billions) |
Gross Profit (in billions) |
Revenue Growth |
| Apple Inc |
35.99 |
53.80 |
9.68 |
39.36% |
$35.55 |
$48.34 |
7.94% |
| Western Digital Corp |
22.95 |
9.46 |
5.85 |
20.57% |
$1.48 |
$1.23 |
27.4% |
| Hewlett Packard Enterprise Co |
27.59 |
1.27 |
0.95 |
1.14% |
$1.11 |
$2.67 |
18.5% |
| Pure Storage Inc |
219.68 |
22.44 |
9.16 |
3.68% |
$0.09 |
$0.6 |
12.73% |
| Super Micro Computer Inc |
31.31 |
3.62 |
1.20 |
2.62% |
$0.26 |
$0.54 |
-12.84% |
| NetApp Inc |
19.99 |
23.13 |
3.54 |
23.13% |
$0.38 |
$1.1 |
1.17% |
| Logitech International SA |
27.36 |
8.49 |
3.86 |
7.99% |
$0.22 |
$0.51 |
6.27% |
| Diebold Nixdorf Inc |
47.78 |
2.09 |
0.66 |
3.73% |
$0.11 |
$0.25 |
1.95% |
| Turtle Beach Corp |
14.73 |
2.39 |
0.85 |
-2.47% |
$0.0 |
$0.02 |
-25.76% |
| Average |
51.42 |
9.11 |
3.26 |
7.55% |
$0.46 |
$0.86 |
3.68% |
Upon analyzing Apple, the following trends can be observed:
-
The stock's Price to Earnings ratio of 35.99 is lower than the industry average by 0.7x, suggesting potential value in the eyes of market participants.
-
With a Price to Book ratio of 53.8, which is 5.91x the industry average, Apple might be considered overvalued in terms of its book value, as it is trading at a higher multiple compared to its industry peers.
-
With a relatively high Price to Sales ratio of 9.68, which is 2.97x the industry average, the stock might be considered overvalued based on sales performance.
-
The Return on Equity (ROE) of 39.36% is 31.81% above the industry average, highlighting efficient use of equity to generate profits.
-
The Earnings Before Interest, Taxes, Depreciation, and Amortization (EBITDA) of $35.55 Billion is 77.28x above the industry average, highlighting stronger profitability and robust cash flow generation.
-
Compared to its industry, the company has higher gross profit of $48.34 Billion, which indicates 56.21x above the industry average, indicating stronger profitability and higher earnings from its core operations.
-
The company's revenue growth of 7.94% exceeds the industry average of 3.68%, indicating strong sales performance and market outperformance.
Debt To Equity Ratio
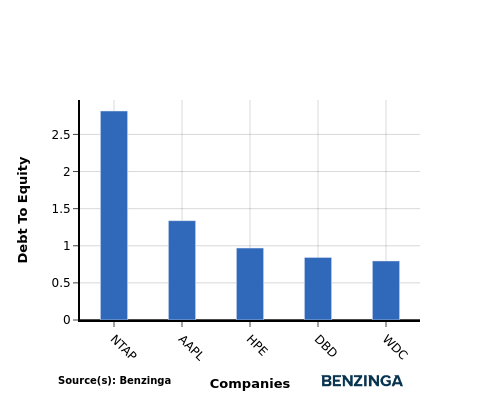
The debt-to-equity (D/E) ratio assesses the extent to which a company relies on borrowed funds compared to its equity.
Considering the debt-to-equity ratio in industry comparisons allows for a concise evaluation of a company's financial health and risk profile, aiding in informed decision-making.
By evaluating Apple against its top 4 peers in terms of the Debt-to-Equity ratio, the following observations arise:
-
Among its top 4 peers, Apple is placed in the middle with a moderate debt-to-equity ratio of 1.34.
-
This implies a balanced financial structure, with a reasonable proportion of debt and equity.
Key Takeaways
For Apple in the Technology Hardware, Storage & Peripherals industry, the PE ratio is low compared to peers, indicating potential undervaluation. The high PB and PS ratios suggest a premium valuation based on book value and sales. In terms of profitability, Apple's high ROE, EBITDA, gross profit, and revenue growth outperform industry peers, reflecting strong financial performance and growth potential.
This article was generated by Benzinga's automated content engine and reviewed by an editor.
Posted In: AAPL


