Investigating NVIDIA's Standing In Semiconductors & Semiconductor Equipment Industry Compared To Competitors
Author: Benzinga Insights | November 12, 2025 10:00am
In today's fast-paced and highly competitive business world, it is crucial for investors and industry followers to conduct comprehensive company evaluations. In this article, we will delve into an extensive industry comparison, evaluating NVIDIA (NASDAQ:NVDA) in relation to its major competitors in the Semiconductors & Semiconductor Equipment industry. By closely examining key financial metrics, market standing, and growth prospects, our objective is to provide valuable insights and highlight company's performance in the industry.
NVIDIA Background
Nvidia is a leading developer of graphics processing units. Traditionally, GPUs were used to enhance the experience on computing platforms, most notably in gaming applications on PCs. GPU use cases have since emerged as important semiconductors used in artificial intelligence to run large language models. Nvidia not only offers AI GPUs, but also a software platform, Cuda, used for AI model development and training. Nvidia is also expanding its data center networking solutions, helping to tie GPUs together to handle complex workloads.
| Company |
P/E |
P/B |
P/S |
ROE |
EBITDA (in billions) |
Gross Profit (in billions) |
Revenue Growth |
| NVIDIA Corp |
55.03 |
46.97 |
28.82 |
28.72% |
$31.94 |
$33.85 |
55.6% |
| Broadcom Inc |
90.25 |
22.68 |
28.41 |
5.8% |
$8.29 |
$10.7 |
22.03% |
| Advanced Micro Devices Inc |
124.36 |
6.36 |
12.11 |
2.06% |
$2.11 |
$4.78 |
35.59% |
| Micron Technology Inc |
31.77 |
5 |
7.26 |
6.1% |
$5.9 |
$5.05 |
46.0% |
| Qualcomm Inc |
34.73 |
8.79 |
4.34 |
-12.88% |
$3.51 |
$6.24 |
10.03% |
| Intel Corp |
631.33 |
1.70 |
3.12 |
3.98% |
$7.85 |
$5.22 |
2.78% |
| ARM Holdings PLC |
191.97 |
21.45 |
36.18 |
3.3% |
$0.22 |
$1.11 |
34.48% |
| Texas Instruments Inc |
29.09 |
8.73 |
8.47 |
8.21% |
$2.24 |
$2.72 |
14.24% |
| Analog Devices Inc |
59.39 |
3.37 |
11.19 |
1.5% |
$1.33 |
$1.79 |
24.57% |
| NXP Semiconductors NV |
25.08 |
5.08 |
4.29 |
6.43% |
$1.11 |
$1.79 |
-2.37% |
| Monolithic Power Systems Inc |
24.49 |
12.82 |
17.27 |
5.12% |
$0.21 |
$0.41 |
18.88% |
| ASE Technology Holding Co Ltd |
29.96 |
3.20 |
1.63 |
3.56% |
$32.4 |
$28.88 |
5.29% |
| First Solar Inc |
20.27 |
3.14 |
5.62 |
5.19% |
$0.61 |
$0.61 |
79.67% |
| Credo Technology Group Holding Ltd |
220.14 |
35.09 |
49.13 |
8.67% |
$0.07 |
$0.15 |
273.57% |
| STMicroelectronics NV |
40.86 |
1.18 |
1.87 |
1.33% |
$0.31 |
$1.06 |
-1.97% |
| ON Semiconductor Corp |
66.34 |
2.51 |
3.27 |
3.22% |
$0.38 |
$0.55 |
5.6% |
| United Microelectronics Corp |
13.54 |
1.59 |
2.40 |
4.29% |
$30.07 |
$17.62 |
-2.25% |
| Rambus Inc |
49.97 |
8.77 |
16.82 |
3.84% |
$0.08 |
$0.14 |
22.68% |
| Tower Semiconductor Ltd |
57.68 |
3.93 |
7.47 |
1.9% |
$0.13 |
$0.09 |
6.79% |
| Average |
96.73 |
8.63 |
12.27 |
3.42% |
$5.38 |
$4.94 |
33.09% |
After thoroughly examining NVIDIA, the following trends can be inferred:
-
A Price to Earnings ratio of 55.03 significantly below the industry average by 0.57x suggests undervaluation. This can make the stock appealing for those seeking growth.
-
With a Price to Book ratio of 46.97, which is 5.44x the industry average, NVIDIA might be considered overvalued in terms of its book value, as it is trading at a higher multiple compared to its industry peers.
-
With a relatively high Price to Sales ratio of 28.82, which is 2.35x the industry average, the stock might be considered overvalued based on sales performance.
-
The Return on Equity (ROE) of 28.72% is 25.3% above the industry average, highlighting efficient use of equity to generate profits.
-
The Earnings Before Interest, Taxes, Depreciation, and Amortization (EBITDA) of $31.94 Billion is 5.94x above the industry average, highlighting stronger profitability and robust cash flow generation.
-
The gross profit of $33.85 Billion is 6.85x above that of its industry, highlighting stronger profitability and higher earnings from its core operations.
-
With a revenue growth of 55.6%, which surpasses the industry average of 33.09%, the company is demonstrating robust sales expansion and gaining market share.
Debt To Equity Ratio
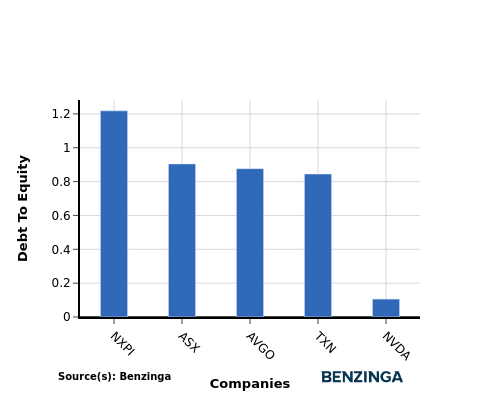
The debt-to-equity (D/E) ratio is a measure that indicates the level of debt a company has taken on relative to the value of its assets net of liabilities.
Considering the debt-to-equity ratio in industry comparisons allows for a concise evaluation of a company's financial health and risk profile, aiding in informed decision-making.
When comparing NVIDIA with its top 4 peers based on the Debt-to-Equity ratio, the following insights can be observed:
-
In terms of the debt-to-equity ratio, NVIDIA has a lower level of debt compared to its top 4 peers, indicating a stronger financial position.
-
This implies that the company relies less on debt financing and has a more favorable balance between debt and equity with a lower debt-to-equity ratio of 0.11.
Key Takeaways
For NVIDIA in the Semiconductors & Semiconductor Equipment industry, the PE ratio is low compared to peers, indicating potential undervaluation. The PB and PS ratios are high, suggesting overvaluation relative to industry standards. In terms of ROE, EBITDA, gross profit, and revenue growth, NVIDIA outperforms its peers, reflecting strong financial performance and growth potential within the sector.
This article was generated by Benzinga's automated content engine and reviewed by an editor.
Posted In: NVDA