Understanding Meta Platforms's Position In Interactive Media & Services Industry Compared To Competitors
Author: Benzinga Insights | November 12, 2025 10:00am
In the ever-changing and fiercely competitive business landscape, conducting thorough company analysis is crucial for investors and industry experts. In this article, we will undertake a comprehensive industry comparison, evaluating Meta Platforms (NASDAQ:META) and its primary competitors in the Interactive Media & Services industry. By closely examining key financial metrics, market position, and growth prospects, our aim is to provide valuable insights for investors and shed light on company's performance within the industry.
Meta Platforms Background
Meta is the largest social media company in the world, boasting close to 4 billion monthly active users worldwide. The firm's "Family of Apps," its core business, consists of Facebook, Instagram, Messenger, and WhatsApp. End users can leverage these applications for a variety of different purposes, from keeping in touch with friends to following celebrities and running digital businesses for free. Meta packages customer data, gleaned from its application ecosystem and sells ads to digital advertisers. While the firm has been investing heavily in its Reality Labs business, it remains a very small part of Meta's overall sales.
| Company |
P/E |
P/B |
P/S |
ROE |
EBITDA (in billions) |
Gross Profit (in billions) |
Revenue Growth |
| Meta Platforms Inc |
27.75 |
8.14 |
8.56 |
1.39% |
$26.85 |
$42.04 |
26.25% |
| Alphabet Inc |
28.76 |
9.09 |
9.26 |
9.33% |
$49.74 |
$60.98 |
15.95% |
| Baidu Inc |
12.06 |
1.17 |
2.45 |
2.69% |
$8.84 |
$14.36 |
-3.59% |
| Reddit Inc |
95.95 |
15.11 |
21.39 |
6.51% |
$0.14 |
$0.53 |
67.91% |
| Pinterest Inc |
9.60 |
3.83 |
4.66 |
1.91% |
$0.07 |
$0.84 |
16.79% |
| Bilibili Inc |
364.60 |
5.64 |
2.79 |
1.53% |
$0.81 |
$2.68 |
19.76% |
| ZoomInfo Technologies Inc |
34.13 |
2.15 |
2.83 |
2.51% |
$0.09 |
$0.27 |
4.74% |
| CarGurus Inc |
23.41 |
8.81 |
3.89 |
11.03% |
$0.06 |
$0.21 |
3.17% |
| Weibo Corp |
7.60 |
0.73 |
1.62 |
3.58% |
$0.15 |
$0.34 |
1.58% |
| Tripadvisor Inc |
25.77 |
2.56 |
1.12 |
7.95% |
$0.1 |
$0.51 |
3.95% |
| Yelp Inc |
13.10 |
2.46 |
1.34 |
5.32% |
$0.07 |
$0.34 |
4.36% |
| FuboTV Inc |
12.06 |
3.29 |
0.93 |
-4.64% |
$-0.01 |
$0.08 |
-2.33% |
| Ziff Davis Inc |
12.56 |
0.71 |
0.93 |
-0.2% |
$0.07 |
$0.31 |
2.87% |
| Taboola.com Ltd |
51.75 |
1.31 |
0.71 |
0.57% |
$0.03 |
$0.14 |
14.72% |
| Average |
53.18 |
4.37 |
4.15 |
3.7% |
$4.63 |
$6.28 |
11.53% |
After a detailed analysis of Meta Platforms, the following trends become apparent:
-
At 27.75, the stock's Price to Earnings ratio is 0.52x less than the industry average, suggesting favorable growth potential.
-
With a Price to Book ratio of 8.14, which is 1.86x the industry average, Meta Platforms might be considered overvalued in terms of its book value, as it is trading at a higher multiple compared to its industry peers.
-
The stock's relatively high Price to Sales ratio of 8.56, surpassing the industry average by 2.06x, may indicate an aspect of overvaluation in terms of sales performance.
-
The company has a lower Return on Equity (ROE) of 1.39%, which is 2.31% below the industry average. This indicates potential inefficiency in utilizing equity to generate profits, which could be attributed to various factors.
-
Compared to its industry, the company has higher Earnings Before Interest, Taxes, Depreciation, and Amortization (EBITDA) of $26.85 Billion, which is 5.8x above the industry average, indicating stronger profitability and robust cash flow generation.
-
The gross profit of $42.04 Billion is 6.69x above that of its industry, highlighting stronger profitability and higher earnings from its core operations.
-
The company's revenue growth of 26.25% is notably higher compared to the industry average of 11.53%, showcasing exceptional sales performance and strong demand for its products or services.
Debt To Equity Ratio
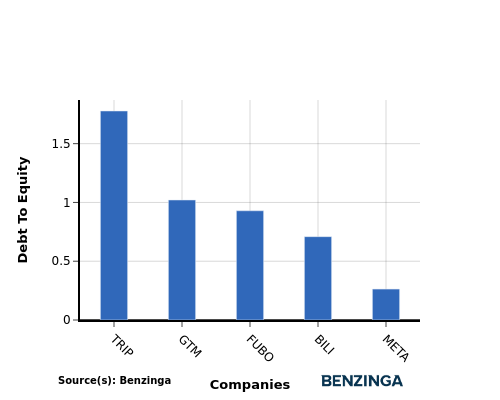
The debt-to-equity (D/E) ratio provides insights into the proportion of debt a company has in relation to its equity and asset value.
Considering the debt-to-equity ratio in industry comparisons allows for a concise evaluation of a company's financial health and risk profile, aiding in informed decision-making.
When assessing Meta Platforms against its top 4 peers using the Debt-to-Equity ratio, the following comparisons can be made:
-
Meta Platforms demonstrates a stronger financial position compared to its top 4 peers in the sector.
-
With a lower debt-to-equity ratio of 0.26, the company relies less on debt financing and maintains a healthier balance between debt and equity, which can be viewed positively by investors.
Key Takeaways
The low PE ratio suggests Meta Platforms may be undervalued compared to its peers in the Interactive Media & Services industry. However, the high PB and PS ratios indicate a potential overvaluation. In terms of ROE, Meta Platforms is performing poorly compared to its peers. On the other hand, the high EBITDA, gross profit, and revenue growth indicate strong financial performance relative to industry competitors.
This article was generated by Benzinga's automated content engine and reviewed by an editor.
Posted In: META