Decoding Johnson & Johnson's Options Activity: What's the Big Picture?
Author: Benzinga Insights | November 13, 2025 11:01am
Whales with a lot of money to spend have taken a noticeably bullish stance on Johnson & Johnson.
Looking at options history for Johnson & Johnson (NYSE:JNJ) we detected 8 trades.
If we consider the specifics of each trade, it is accurate to state that 37% of the investors opened trades with bullish expectations and 25% with bearish.
From the overall spotted trades, 4 are puts, for a total amount of $243,357 and 4, calls, for a total amount of $346,731.
Projected Price Targets
Analyzing the Volume and Open Interest in these contracts, it seems that the big players have been eyeing a price window from $187.5 to $195.0 for Johnson & Johnson during the past quarter.
Volume & Open Interest Development
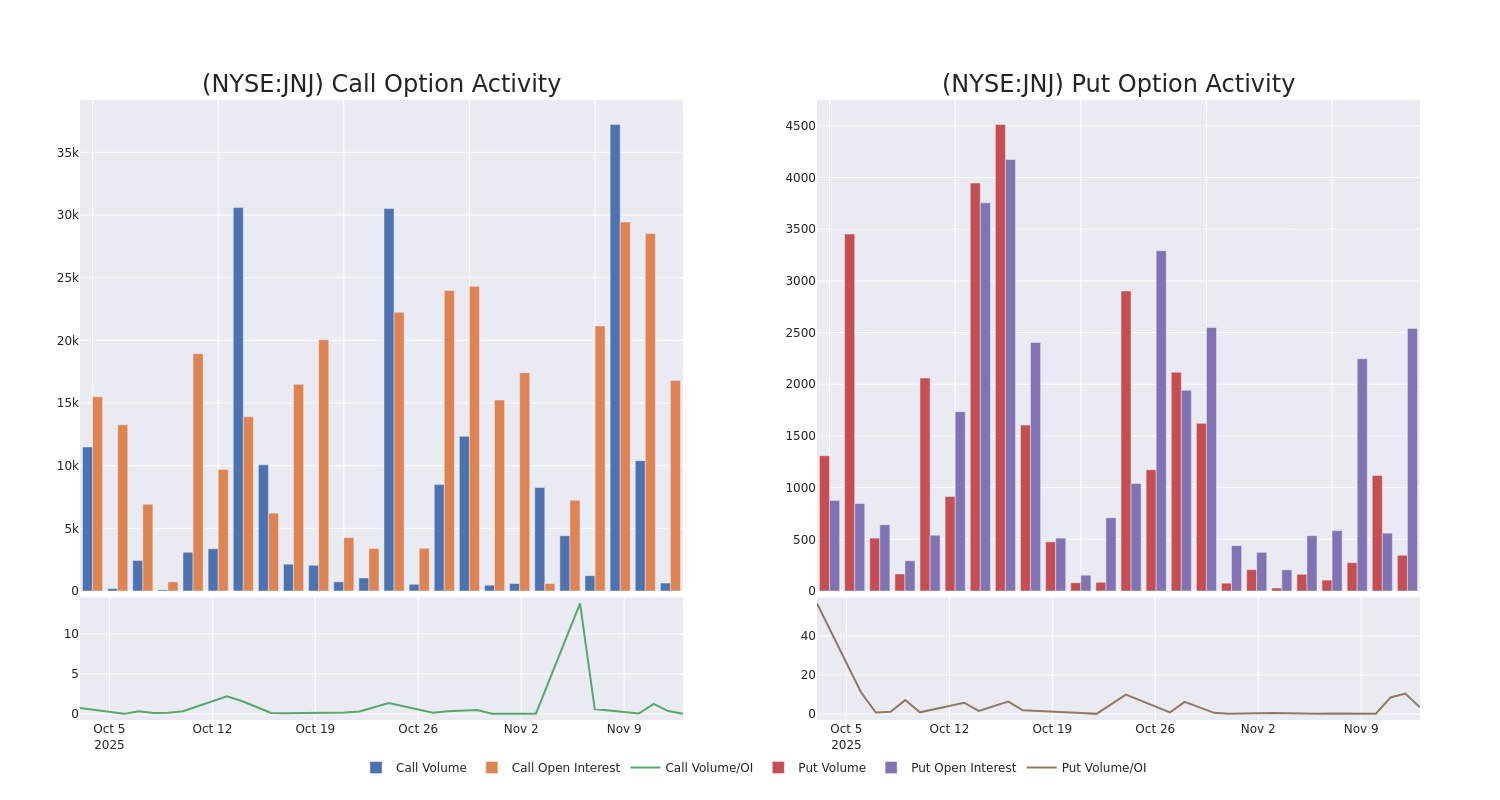
Looking at the volume and open interest is a powerful move while trading options. This data can help you track the liquidity and interest for Johnson & Johnson's options for a given strike price. Below, we can observe the evolution of the volume and open interest of calls and puts, respectively, for all of Johnson & Johnson's whale trades within a strike price range from $187.5 to $195.0 in the last 30 days.
Johnson & Johnson 30-Day Option Volume & Interest Snapshot
Noteworthy Options Activity:
| Symbol |
PUT/CALL |
Trade Type |
Sentiment |
Exp. Date |
Ask |
Bid |
Price |
Strike Price |
Total Trade Price |
Open Interest |
Volume |
| JNJ |
CALL |
SWEEP |
NEUTRAL |
11/21/25 |
$6.65 |
$5.5 |
$6.07 |
$190.00 |
$156.1K |
14.3K |
513 |
| JNJ |
CALL |
TRADE |
BULLISH |
06/18/26 |
$12.65 |
$11.65 |
$12.33 |
$195.00 |
$123.3K |
764 |
63 |
| JNJ |
PUT |
TRADE |
BULLISH |
12/19/25 |
$2.72 |
$2.44 |
$2.5 |
$190.00 |
$102.5K |
2.4K |
178 |
| JNJ |
PUT |
SWEEP |
BEARISH |
09/18/26 |
$13.15 |
$12.25 |
$13.15 |
$195.00 |
$71.0K |
29 |
58 |
| JNJ |
CALL |
TRADE |
BEARISH |
11/21/25 |
$8.65 |
$8.3 |
$8.3 |
$187.50 |
$41.5K |
1.6K |
67 |
About Johnson & Johnson
Johnson & Johnson is the world's largest and most diverse healthcare firm. It has two divisions: innovative medicine and medtech. These now represent all of the company's sales following the divestment of the consumer business, Kenvue, in 2023. After restructurings in 2023-24, the drug division focuses on three main therapeutic areas: immunology, oncology, and neurology. Geographically, just over half of total revenue is generated in the United States.
In light of the recent options history for Johnson & Johnson, it's now appropriate to focus on the company itself. We aim to explore its current performance.
Current Position of Johnson & Johnson
- With a trading volume of 1,685,380, the price of JNJ is up by 0.48%, reaching $195.31.
- Current RSI values indicate that the stock is may be approaching overbought.
- Next earnings report is scheduled for 69 days from now.
Expert Opinions on Johnson & Johnson
Over the past month, 5 industry analysts have shared their insights on this stock, proposing an average target price of $198.8.
Turn $1000 into $1270 in just 20 days?
20-year pro options trader reveals his one-line chart technique that shows when to buy and sell. Copy his trades, which have had averaged a 27% profit every 20 days. Click here for access.
* An analyst from Citigroup has decided to maintain their Buy rating on Johnson & Johnson, which currently sits at a price target of $215.
* Consistent in their evaluation, an analyst from Raymond James keeps a Outperform rating on Johnson & Johnson with a target price of $209.
* An analyst from Freedom Capital Markets has revised its rating downward to Hold, adjusting the price target to $190.
* An analyst from Stifel has decided to maintain their Hold rating on Johnson & Johnson, which currently sits at a price target of $190.
* Maintaining their stance, an analyst from Morgan Stanley continues to hold a Equal-Weight rating for Johnson & Johnson, targeting a price of $190.
Trading options involves greater risks but also offers the potential for higher profits. Savvy traders mitigate these risks through ongoing education, strategic trade adjustments, utilizing various indicators, and staying attuned to market dynamics. Keep up with the latest options trades for Johnson & Johnson with Benzinga Pro for real-time alerts.
Posted In: JNJ